
| | ||||||||||||||
| ||||||||||||||
2D structure prediction for record 2ZZM_B
REFERENCE VS PREDICTED RNA SECONDARY STRUCTURE
Figure 1. Graph showing comparison of reference (upper part) and predicted by (lower part) secondary structures of RNA chain 2ZZM_B.
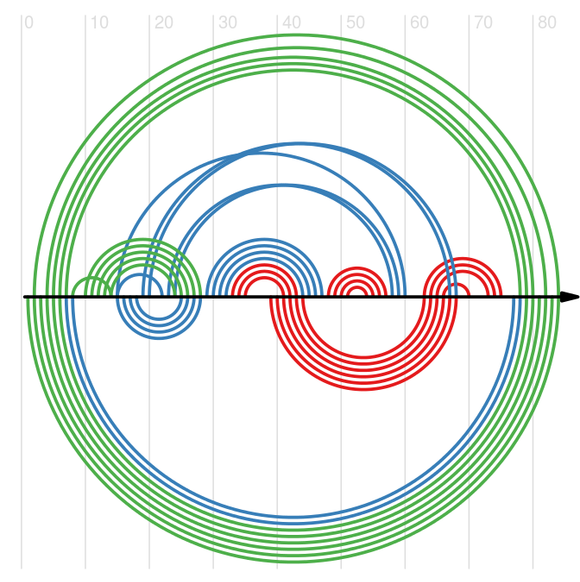
Table 1. Summary of base pair counts (true positives, true negatives, etc). Individual counts can be directly read on the graph above or can be extracted by comparing two bpseq files above.
| Base Pair Counts | |
|---|---|
| MCC | 0.12 |
| SENS | 0.09 |
| PPV | 0.17 |
| TP | 3 |
| TN | 3468 |
| FP | 15 |
| FP CONTRA | 0 |
| FP INCONS | 15 |
| FP COMP | 0 |
| FN | 29 |
RNA 2D structure plot generated with R-Chie.