
| | ||||||||||||||
| ||||||||||||||
Frequently Asked Questions
Table of contents:
- 1. General questions
- 1.1. What is CompaRNA?
- 1.2. How to cite CompaRNA?
- 1.3. What was the rationale for creating CompaRNA?
- 1.4. Who should use CompaRNA?
- 1.5. What are the benefits of using CompaRNA?
- 2. CompaRNA details
- 2.1. How does CompaRNA work?
- 2.2. Is it possible to view or download reference secondary structures?
- 2.3. Why does CompaRNA replace post-transcriptionally modified nucleotides with unmodified ones in RNA structures downloaded from the PDB database?
- 2.4. Where to find a list of all post-transcriptionally modified nucleotides occurring in RNA?
- 3. Testing RNA secondary structure prediction methods
- 3.1. How long has CompaRNA been running?
- 3.2. Are all RNA chains extracted by CompaRNA from the PDB database used for testing methods predicting RNA secondary structure?
- 3.3. Which metrics does CompaRNA use to compare predicted vs reference RNA secondary structures?
- 3.4. I am a developer of a method predicting RNA secondary structure. What do I have to do to make CompaRNA benchmark the performance of my method?
1. General questions
1.1. What is CompaRNA?
The CompaRNA web server provides continuous benchmarking of freely available web servers and stand-alone automated methods for RNA structure prediction. It has been inspired by the EVA and Livebench servers for benchmarking of protein structure prediction tools, which have greatly contributed to the progress in structural bioinformatics. The aim of CompaRNA is to assess the state of the art in the field, provide a detailed picture of what is possible with the available tools, where the progress is made and what major problems remain. All currently available rankings are available in the Rankings section.
The results of the benchmarks and the functionality of the CompaRNA web server have been described in a publication in Nucleic Acids Research journal.
1.2. How to cite CompaRNA?
Puton T., Kozlowski L.P., Rother K.M., Bujnicki J.M. (2013)
CompaRNA: a server for continuous benchmarking of automated methods for RNA secondary structure prediction.
Nucleic Acids Research doi: 10.1093/nar/gkt101
link to NAR
1.3. What was the rationale for creating CompaRNA?
Molecules of ribonucleic acid play many crucial roles in living organisms, as a carrier of a genetic
information, regulator of its expression and as a molecule responsible for conducting catalytic reactions.
In order to understand various roles played by RNA molecules, one needs to gather information about their structures,
which directly determine their functions. If there are experimentally derived RNA structures
(e.g. from X-ray crystallography or NMR) one can analyze interactions of RNA with other molecules
(e.g. ions, proteins or nucleic acids).
Otherwise, the only alternative is to use bioinformatics tools to generate models of RNA structure.
Therefore various computational tools to predict RNA structure have been created.
These tools include methods predicting RNA secondary and tertiary structure as well as protein-RNA interactions.
However,
before the advent of CompaRNA there was no tool, which would allow for testing of performance of
individual RNA structure prediction methods.
The CASP experiments have shown the
importance of the objective assessment of methods and
techniques for predicting protein structure. There have been no analogous initiatives in the field of
structural bioinformatics of RNA so far and we strongly believe that the CompaRNA server will allow for
reliable testing of performance of computational methods predicting RNA structure.
1.4. Who should use CompaRNA?
CompaRNA has been developed for both users and developers of methods predicting RNA structure.
1.5. What are the benefits of using CompaRNA?
The CompaRNA server checks PDB database for the release of new RNAs, which are used in benchmarking methods predicting RNA secondary
structure. This allows for a live performance assessment of tested methods (in particular, the web servers) and/or
for a comparison of their strengths and weaknesses.
The CompaRNA web server also provides the community with a ‘static’ benchmark,
generated on a data set extracted from the RNAstrand database,
which contains experimentally verified RNA secondary structures of any type and organism.
RNAstrand includes a larger number of molecules than those with solved 3D structures,
and it covers sequences that are on the average longer than those with known 3D structures.
These benchmarks offer insight into the relative performance of different RNA secondary
structure prediction methods on different types of RNA sequences and structures.
2. CompaRNA details
2.1. How does CompaRNA work?
Figure 1 shows a simplified diagram of how CompaRNA works.
The server constantly monitors the Protein Data Bank (PDB) for
the release of new RNA structures solved experimentally. When new RNA structures are released it downloads
and stores them. It subsequently uses ModeRNA software
to replace post-transcriptionally modified nucleotides in RNA to unmodified ones.
Such RNAs are analyzed with RNAVIEW
program to calculate their secondary structures.
Secondary structures are extracted from the PDB files according to two
definitions—‘standard’ and ‘extended’. The standard RNA base pair definition follows
the Leontis and Westhof
classification, i.e. the canonical A–U, G–C and wobble G–U pairs that belong to
the cis Watson–Crick/Watson–Crick geometry are considered as the secondary structure.
The ‘extended’ secondary structure definition includes base pairs interacting using
the Watson–Crick, Hoogsteen or sugar edges, in both cis and trans orientations.
It also includes base pairs conforming to the ‘standard’ definition.
RNA secondary structures obtained in this way are treated as reference in
tests of methods predicting RNA secondary structure. RNAs from the RNAstrand
are processed in a similar manner, the only difference is that only the
extended base pairs definiton was used.
Figure 1. A simplified diagram of how CompaRNA works.
Moreover, CompaRNA also presents benchmarks of RNA secondary structure prediction methods generated on datasets extracted from the RNAstrand database.
For a detailed description of how CompaRNA works please see the original CompaRNA
publication in
Nucleic Acids Research.
2.2. Is it possible to view or download reference secondary structures?
Yes, it is.
In case of the PDB datasets, you have to go to the main page and choose appropriate link
from 'Reference RNA structures' box. You can also get the reference RNA structures,
by either clicking Reference RNA structures from the latest update of PDB database or
All reference RNA structures collected by CompaRNA. Reference RNA
structure are available in both .pdb and .bpseq formats for tertiary and secondary structures, respectively.
They do not contain post-transcriptional modifications, which have been replaced with unmodified nucleotides by
ModeRNA.
Moreover, both the PDB and RNAstrand datasets can be also found in Datasets section.
2.3. Why does CompaRNA replace post-transcriptionally modified nucleotides with unmodified ones in RNA structures downloaded from the PDB database?
During the automatic processing of RNA structures downloaded from the PDB database, CompaRNA replaces post-transcriptionally modified nucleotides with unmodified ones using the ModeRNA software. This step is critical because bioinformatics methods used for RNA secondary structure predictions can only handle input RNA sequences containing four unmodified characters (i.e. the standard nucleotides: A, U, C and G). Once all post-transcriptionally modified nucleotides are replaced, RNAVIEW is used for generating reference RNA secondary structures according to the Leontis & Westhof base pairs classification.
2.4. Where to find a list of all post-transcriptionally modified nucleotides occurring in RNA?
A full list of post-transcriptionally modified nucleotides and their abbreviations can be found in the MODOMICS database.
3. Testing RNA secondary structure prediction methods
3.1. How long has CompaRNA been running?
The server has been active since February 18th, 2009 with a focus on methods for
secondary structure prediction: 10 methods as remote servers and further 49 methods installed locally have been
benchmarked.
In case of benchmarks created on the PDB datasets, a total of 4177 RNA chains from 1935 PDB files have been
analyzed. Out of them, only 342 RNA chains are considered valid fror benchmarking methods predicting RNA secondary structure.
For those 342 RNA sequences, 8054 predictions have been collected.
On the contrary, RNAstrand dataset is much larger - 1987 records are used as reference,
for which 121207 predictions have been collected.
3.2. Are all RNA chains extracted by CompaRNA from the PDB database used for testing methods predicting RNA secondary structure?
No. When CompaRNA finishes extracting RNA chains from newly downloaded PDB files,
they are manually checked whether they can be used in benchmarking methods predicting RNA
secondary structure. Examples of RNA chains that in our opinion should not be used
(and haven’t been used) in benchmarking include mainly helices composed of two separate
single-stranded RNA chains (e.g. chains E & F from
3KS8 PDB
record) or single-stranded RNA chains that base-pair with single-stranded DNA
(e.g. RNA chain M from the 3GTM PDB record).
In the figure below one can see that chain M from 3GTM PDB record has been marked as invalid ('V' column).

Validity of RNA chains extracted by CompaRNA can be checked by using the links below:
Reference RNA structures from the latest update of PDB database
All reference RNA structures collected by CompaRNA
3.3. Which metrics does CompaRNA use to compare predicted vs reference RNA secondary structures?
Evaluations of agreement between the predictions and experimental structures are based on
the sensitivity, Positive Predictive Value and Matthews correlation coefficient parameters
(Gardner & Giegerich, 2004).
These three metrics are used to create rankings of performance of methods predicting RNA secondary structure.
Sensitivity is defined as follows:
where TP is the number of true positives (i.e. correctly predicted base pairs) and FN is the number of false negatives (i.e. predicted base pairs, which are not present in the reference structure).
Next equation defines Positive Predictive Value:
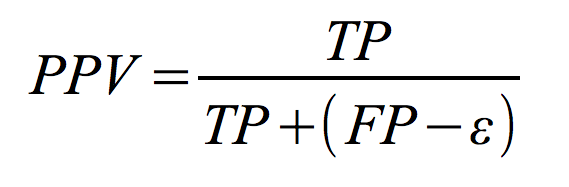
where TP is the number of true positives, FP is the number of false positives (i.e. base pairs, which were predicted incorrectly) and epsilon is the so called 'compatible' fraction of false positives, which "can be considered neutral with respect to algorithm's accuracy" as defined by Gardner & Giegerich.
Matthews correlation coefficient combines both sensitivity and Positive Predictive Value. It can be defined as follows:
where TP is the number of true positives, FP is the number of false positives, epsilon is the 'compatible' fraction of false positives and TN is the number of true negatives.
3.4. I am a developer of a method predicting RNA secondary structure. What do I have to do to make CompaRNA benchmark the performance of my method?
Send the request to CompaRNA developers via our on-line e-mail form or from your mail client to comparna@amu.edu.pl. Please include a short description of your method.