Table of contents:
- Overview
- Performance Plots
- Performance of PETfold_pre2.0(seed)
- scored higher in this pairwise comparison
- Performance of CentroidFold
- scored lower in this pairwise comparison
- Compile and download dataset for PETfold_pre2.0(seed) & CentroidFold [.zip] - may take several seconds...
Overview
| Metric |
PETfold_pre2.0(seed) |
|
CentroidFold |
|---|
| MCC |
0.680 |
>
|
0.540 |
| Average MCC ± 95% Confidence Intervals |
0.632
±
0.134
|
>
|
0.558
±
0.169
|
| Sensitivity |
0.551 |
>
|
0.433 |
| Positive Predictive Value |
0.843 |
>
|
0.679 |
| Total TP |
140 |
>
|
110 |
| Total TN |
33612 |
<
|
33616 |
| Total FP |
34 |
<
|
58 |
| Total FP CONTRA |
3 |
<
|
9 |
| Total FP INCONS |
23 |
<
|
43 |
| Total FP COMP |
8 |
>
|
6 |
| Total FN |
114 |
<
|
144 |
| P-value |
0.0 |
Performance plots
-
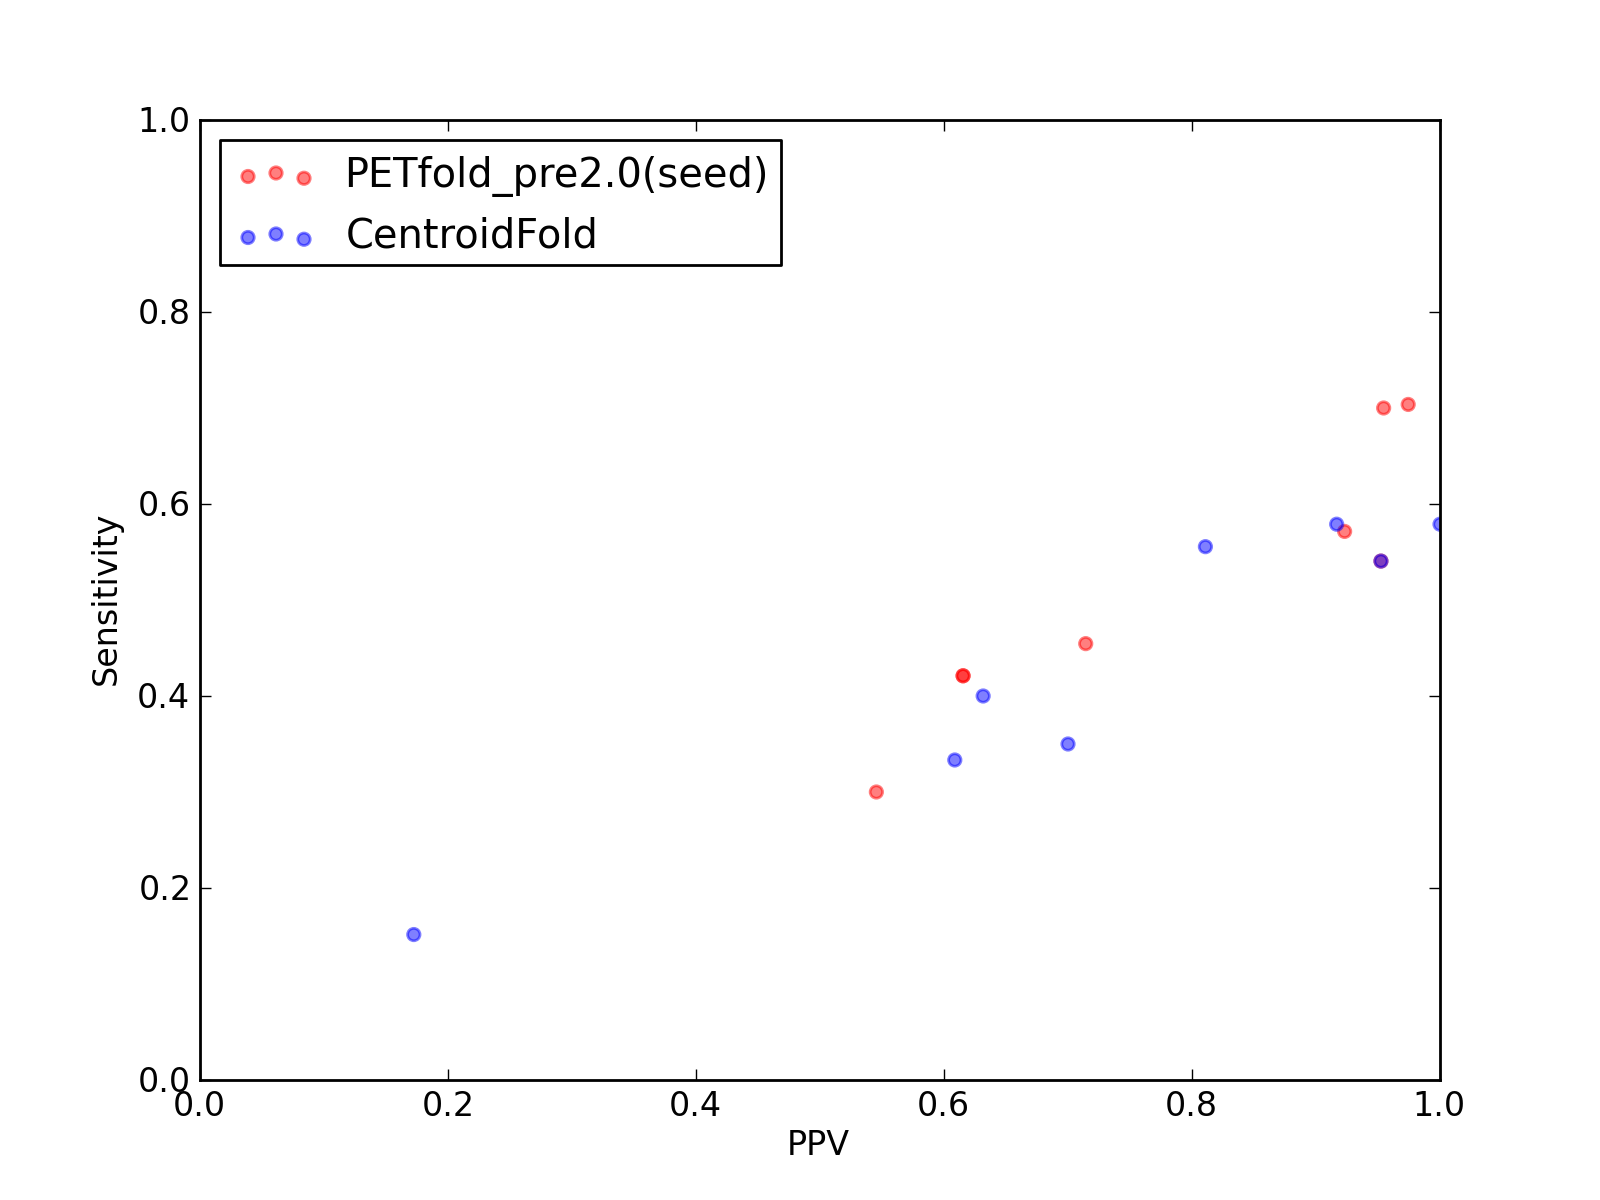
Comparison of performance of PETfold_pre2.0(seed) and CentroidFold. Positive Predictive Value (PPV) is plotted against sensitivity. Each dot represents a single test of each method. See tables below for raw data
(individual counts for PETfold_pre2.0(seed)
and CentroidFold).
-
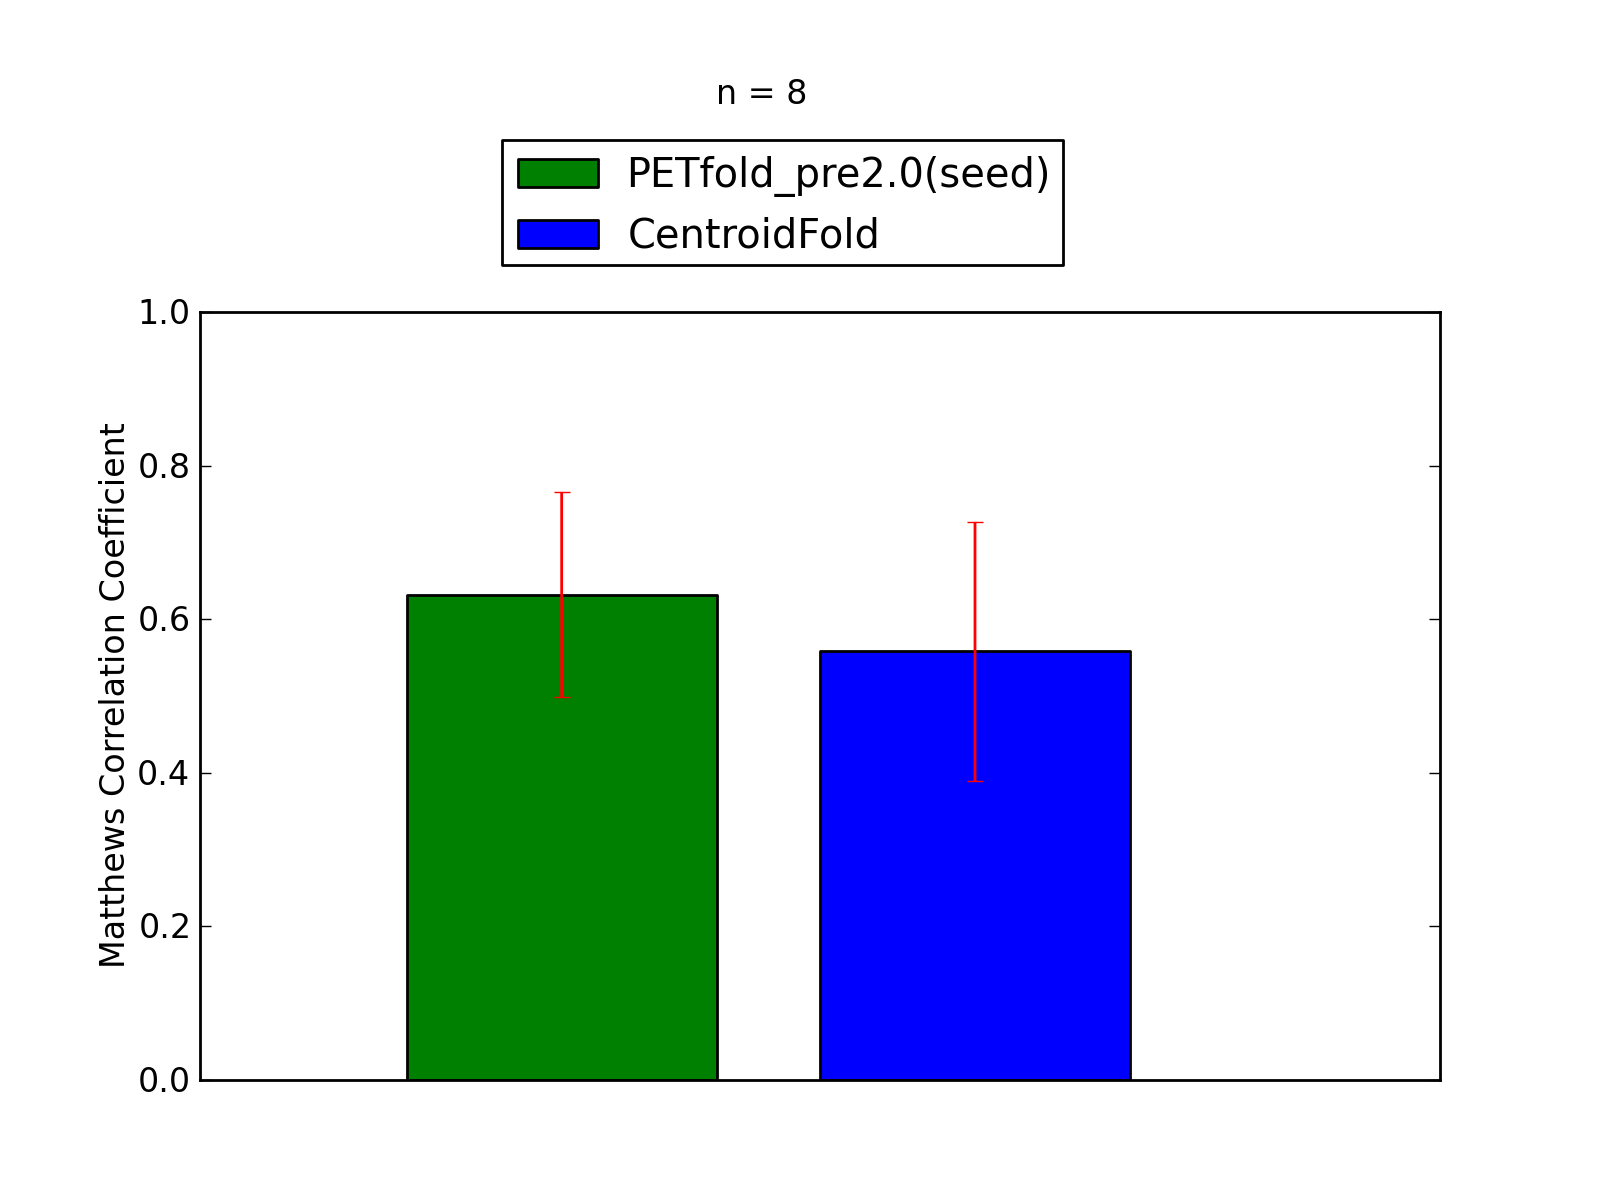
Comparison of average Matthews Correlation Coefficients (MCCs) for PETfold_pre2.0(seed) and CentroidFold. The whiskers correspond to 95% confidence intervals (CIs). 'n' denotes the number of MCCs used to calculate average MCCs and CIs. See tables below for raw data
(individual counts for PETfold_pre2.0(seed)
and CentroidFold).
Performance of PETfold_pre2.0(seed)
- scored higher in this pairwise comparison
1. Total counts & total scores for PETfold_pre2.0(seed)
| Total Base Pair Counts |
|---|
| Total TP |
140 |
| Total TN |
33612 |
| Total FP |
34 |
| Total FP CONTRA |
3 |
| Total FP INCONS |
23 |
| Total FP COMP |
8 |
| Total FN |
114 |
| Total Scores |
|---|
| MCC |
0.680 |
| Average MCC ± 95% Confidence Intervals |
0.632
±
0.134
|
| Sensitivity |
0.551 |
| Positive Predictive Value |
0.843 |
| Nr of predictions |
8 |
Performance of CentroidFold
- scored lower in this pairwise comparison
1. Total counts & total scores for CentroidFold
| Total Base Pair Counts |
|---|
| Total TP |
110 |
| Total TN |
33616 |
| Total FP |
58 |
| Total FP CONTRA |
9 |
| Total FP INCONS |
43 |
| Total FP COMP |
6 |
| Total FN |
144 |
| Total Scores |
|---|
| MCC |
0.540 |
| Average MCC ± 95% Confidence Intervals |
0.558
±
0.169
|
| Sensitivity |
0.433 |
| Positive Predictive Value |
0.679 |
| Nr of predictions |
8 |
Matthews Correlation Coeffient, Sensitivity and Positive Predictive Value have been calculated based
on the paper by Gardener & Giegerich, 2004.
| 