
| | ||||||||||||||
| ||||||||||||||
Table of contents:
- Overview
- Performance Plots
- Performance of PETfold_pre2.0(seed) - scored higher in this pairwise comparison
- Performance of Murlet(seed) - scored lower in this pairwise comparison
- Compile and download dataset for PETfold_pre2.0(seed) & Murlet(seed) [.zip] - may take several seconds...
Overview
| Metric | PETfold_pre2.0(seed) | Murlet(seed) | |
|---|---|---|---|
| MCC | 0.825 | > | 0.569 |
| Average MCC ± 95% Confidence Intervals | 0.842 ± 0.050 | > | 0.550 ± 0.089 |
| Sensitivity | 0.790 | > | 0.383 |
| Positive Predictive Value | 0.863 | > | 0.845 |
| Total TP | 2061 | > | 1000 |
| Total TN | 1503042 | < | 1504247 |
| Total FP | 606 | > | 241 |
| Total FP CONTRA | 43 | > | 15 |
| Total FP INCONS | 285 | > | 169 |
| Total FP COMP | 278 | > | 57 |
| Total FN | 547 | < | 1608 |
| P-value | 3.56938820447e-08 | ||
Performance plots
-
Comparison of performance of PETfold_pre2.0(seed) and Murlet(seed). Positive Predictive Value (PPV) is plotted against sensitivity. Each dot represents a single test of each method. See tables below for raw data (individual counts for PETfold_pre2.0(seed) and Murlet(seed)).

-
Average Matthews Correlation Coefficients (MCC) with 95% confidence intervals (CIs) were plotted for different RNA families, for which at least 3 members were present in the benchmarking dataset. 'n' denotes the number of MCCs used to calculate the average and CI. See tables below for raw data (individual counts for PETfold_pre2.0(seed) and Murlet(seed)).

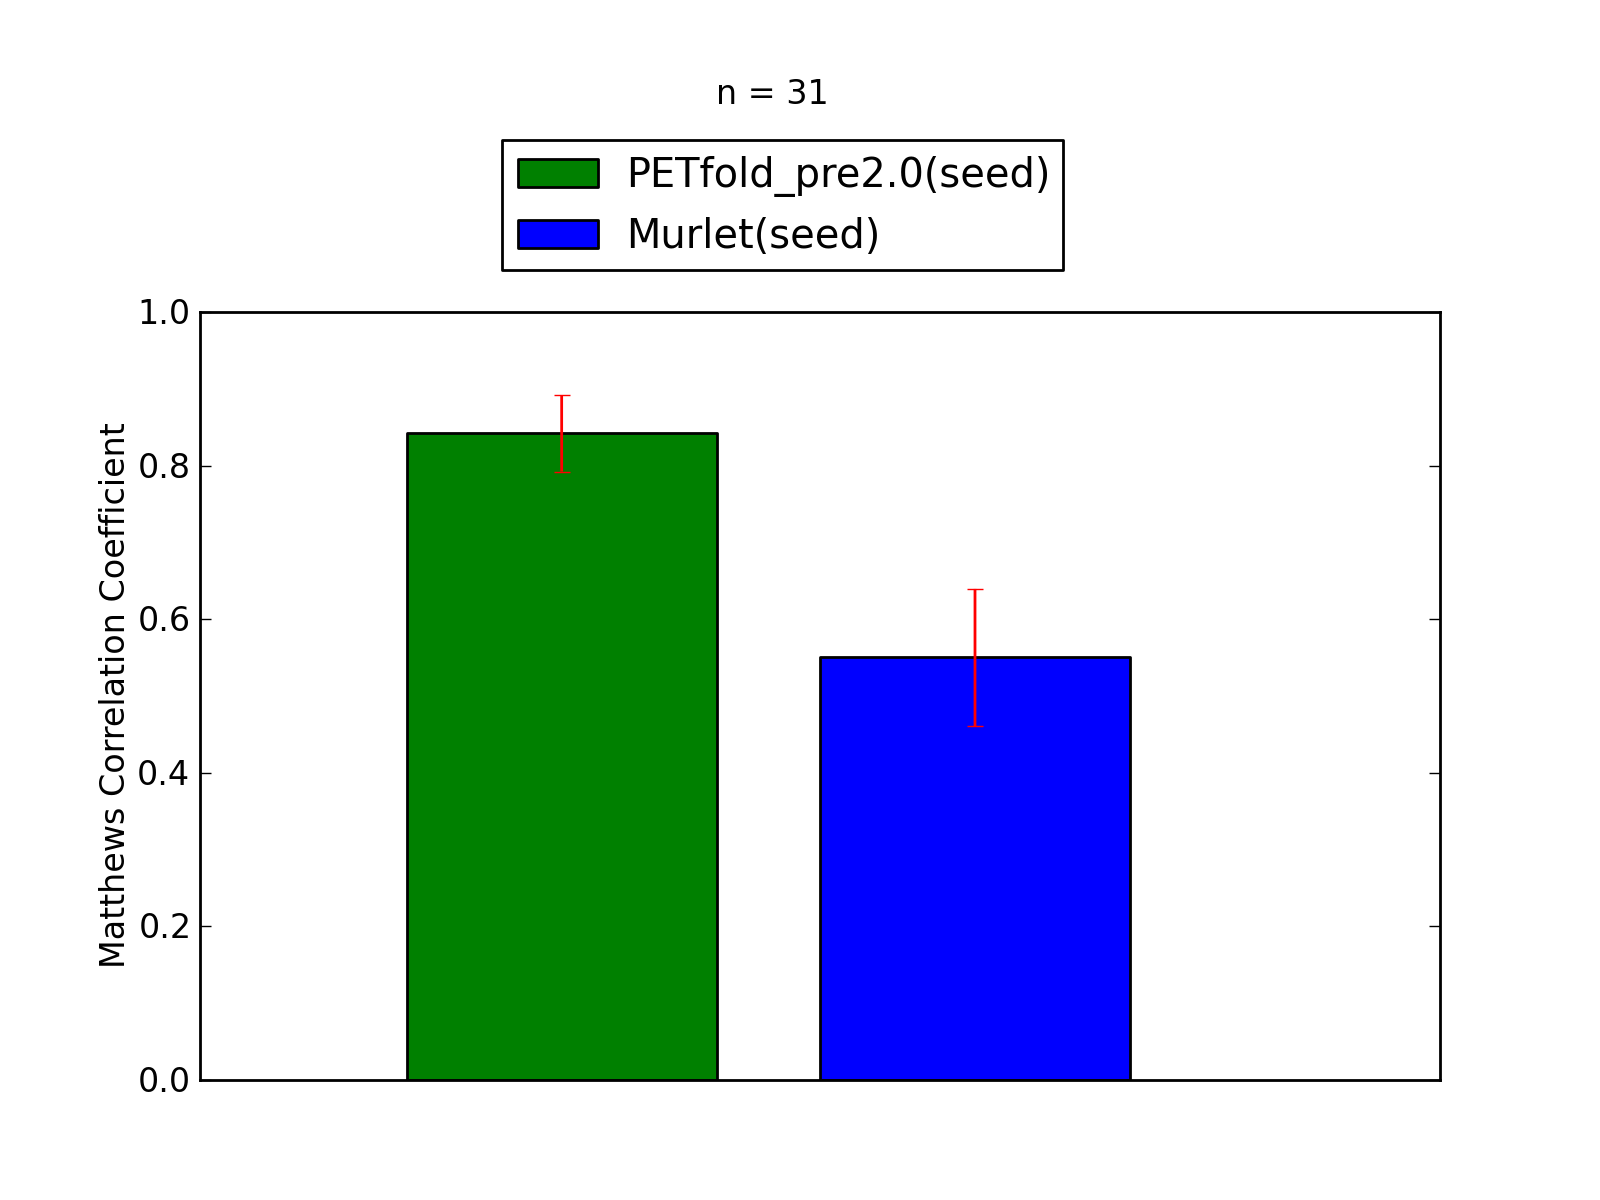
-
Comparison of average Matthews Correlation Coefficients (MCCs) for PETfold_pre2.0(seed) and Murlet(seed). The whiskers correspond to 95% confidence intervals (CIs). 'n' denotes the number of MCCs used to calculate average MCCs and CIs. See tables below for raw data (individual counts for PETfold_pre2.0(seed) and Murlet(seed)).
Performance of PETfold_pre2.0(seed) - scored higher in this pairwise comparison
1. Total counts & total scores for PETfold_pre2.0(seed)
| Total Base Pair Counts | |
|---|---|
| Total TP | 2061 |
| Total TN | 1503042 |
| Total FP | 606 |
| Total FP CONTRA | 43 |
| Total FP INCONS | 285 |
| Total FP COMP | 278 |
| Total FN | 547 |
| Total Scores | |
|---|---|
| MCC | 0.825 |
| Average MCC ± 95% Confidence Intervals | 0.842 ± 0.050 |
| Sensitivity | 0.790 |
| Positive Predictive Value | 0.863 |
| Nr of predictions | 31 |
2. Individual counts for PETfold_pre2.0(seed) [ download as .csv ]
| RNA Chain | Rfam family | MCC | SENS | PPV | TP | TN | FP | FP CONTRA | FP INCONS | FP COMP | FN |
| RFA_00606 | 0.91 | 0.82 | 1.00 | 32 | 21289 | 0 | 0 | 0 | 0 | 7 | |
| RFA_00620 | 0.89 | 0.79 | 1.00 | 31 | 21914 | 0 | 0 | 0 | 0 | 8 | |
| RFA_00626 | 0.96 | 0.92 | 1.00 | 80 | 56536 | 7 | 0 | 0 | 7 | 7 | |
| RFA_00627 | 0.96 | 0.93 | 1.00 | 81 | 56872 | 12 | 0 | 0 | 12 | 6 | |
| RFA_00628 | 0.96 | 0.93 | 1.00 | 80 | 57211 | 12 | 0 | 0 | 12 | 6 | |
| RFA_00630 | 0.92 | 0.87 | 0.97 | 76 | 56875 | 17 | 0 | 2 | 15 | 11 | |
| RFA_00639 | 0.71 | 0.66 | 0.78 | 57 | 54542 | 18 | 2 | 14 | 2 | 30 | |
| RFA_00814 | 0.98 | 0.95 | 1.00 | 39 | 25161 | 5 | 0 | 0 | 5 | 2 | |
| RFA_00815 | 0.98 | 0.95 | 1.00 | 39 | 24492 | 6 | 0 | 0 | 6 | 2 | |
| RFA_00816 | 0.98 | 0.95 | 1.00 | 39 | 23181 | 6 | 0 | 0 | 6 | 2 | |
| RFA_00817 | 0.98 | 0.95 | 1.00 | 39 | 21906 | 4 | 0 | 0 | 4 | 2 | |
| RFA_00818 | 0.98 | 0.95 | 1.00 | 39 | 20262 | 3 | 0 | 0 | 3 | 2 | |
| RFA_00819 | 0.98 | 0.95 | 1.00 | 39 | 27927 | 6 | 0 | 0 | 6 | 2 | |
| RFA_00820 | 0.86 | 0.83 | 0.90 | 132 | 151379 | 33 | 1 | 13 | 19 | 28 | |
| RFA_00830 | 0.75 | 0.73 | 0.78 | 112 | 152485 | 44 | 2 | 29 | 13 | 42 | |
| SRP_00079 | 0.76 | 0.73 | 0.80 | 64 | 41825 | 30 | 0 | 16 | 14 | 24 | |
| SRP_00124 | 0.71 | 0.68 | 0.74 | 58 | 37050 | 32 | 3 | 17 | 12 | 27 | |
| SRP_00182 | 0.88 | 0.84 | 0.91 | 85 | 45963 | 17 | 0 | 8 | 9 | 16 | |
| SRP_00197 | 0.92 | 0.88 | 0.96 | 89 | 49362 | 17 | 1 | 3 | 13 | 12 | |
| SRP_00198 | 0.91 | 0.87 | 0.96 | 90 | 50946 | 16 | 1 | 3 | 12 | 13 | |
| SRP_00199 | 0.89 | 0.86 | 0.93 | 90 | 50943 | 17 | 1 | 6 | 10 | 15 | |
| SRP_00202 | 0.88 | 0.81 | 0.95 | 95 | 54185 | 10 | 1 | 4 | 5 | 22 | |
| SRP_00241 | 0.55 | 0.56 | 0.55 | 46 | 45972 | 53 | 9 | 29 | 15 | 36 | |
| SRP_00255 | 0.79 | 0.77 | 0.81 | 72 | 47497 | 31 | 1 | 16 | 14 | 22 | |
| SRP_00260 | 0.55 | 0.53 | 0.58 | 53 | 47804 | 46 | 6 | 32 | 8 | 47 | |
| SRP_00278 | 0.85 | 0.81 | 0.89 | 85 | 45961 | 15 | 1 | 9 | 5 | 20 | |
| SRP_00322 | 0.86 | 0.81 | 0.93 | 88 | 48421 | 14 | 0 | 7 | 7 | 21 | |
| SRP_00328 | 0.61 | 0.59 | 0.64 | 50 | 39543 | 34 | 5 | 23 | 6 | 35 | |
| SRP_00329 | 0.75 | 0.72 | 0.78 | 61 | 39825 | 29 | 2 | 15 | 12 | 24 | |
| SRP_00339 | 0.85 | 0.82 | 0.89 | 77 | 44464 | 21 | 1 | 9 | 11 | 17 | |
| SRP_00340 | 0.53 | 0.52 | 0.54 | 43 | 41249 | 51 | 6 | 30 | 15 | 39 |
Performance of Murlet(seed) - scored lower in this pairwise comparison
1. Total counts & total scores for Murlet(seed)
| Total Base Pair Counts | |
|---|---|
| Total TP | 1000 |
| Total TN | 1504247 |
| Total FP | 241 |
| Total FP CONTRA | 15 |
| Total FP INCONS | 169 |
| Total FP COMP | 57 |
| Total FN | 1608 |
| Total Scores | |
|---|---|
| MCC | 0.569 |
| Average MCC ± 95% Confidence Intervals | 0.550 ± 0.089 |
| Sensitivity | 0.383 |
| Positive Predictive Value | 0.845 |
| Nr of predictions | 31 |
2. Individual counts for Murlet(seed) [ download as .csv ]
| RNA Chain | Rfam family | MCC | SENS | PPV | TP | TN | FP | FP CONTRA | FP INCONS | FP COMP | FN |
| RFA_00606 | 0.00 | 0.00 | 0.00 | 0 | 21321 | 0 | 0 | 0 | 0 | 39 | |
| RFA_00620 | 0.00 | 0.00 | 0.00 | 0 | 21945 | 0 | 0 | 0 | 0 | 39 | |
| RFA_00626 | 0.81 | 0.66 | 1.00 | 57 | 56559 | 4 | 0 | 0 | 4 | 30 | |
| RFA_00627 | 0.84 | 0.70 | 1.00 | 61 | 56892 | 5 | 0 | 0 | 5 | 26 | |
| RFA_00628 | 0.83 | 0.69 | 1.00 | 59 | 57232 | 8 | 0 | 0 | 8 | 27 | |
| RFA_00630 | 0.82 | 0.67 | 1.00 | 58 | 56895 | 4 | 0 | 0 | 4 | 29 | |
| RFA_00639 | 0.21 | 0.11 | 0.40 | 10 | 54590 | 15 | 4 | 11 | 0 | 77 | |
| RFA_00814 | 0.75 | 0.63 | 0.90 | 26 | 25171 | 4 | 0 | 3 | 1 | 15 | |
| RFA_00815 | 0.83 | 0.68 | 1.00 | 28 | 24503 | 1 | 0 | 0 | 1 | 13 | |
| RFA_00816 | 0.75 | 0.63 | 0.90 | 26 | 23191 | 4 | 0 | 3 | 1 | 15 | |
| RFA_00817 | 0.83 | 0.68 | 1.00 | 28 | 21917 | 1 | 0 | 0 | 1 | 13 | |
| RFA_00818 | 0.83 | 0.68 | 1.00 | 28 | 20273 | 1 | 0 | 0 | 1 | 13 | |
| RFA_00819 | 0.83 | 0.68 | 1.00 | 28 | 27938 | 0 | 0 | 0 | 0 | 13 | |
| RFA_00820 | 0.71 | 0.56 | 0.89 | 90 | 151424 | 13 | 3 | 8 | 2 | 70 | |
| RFA_00830 | 0.59 | 0.45 | 0.78 | 70 | 152538 | 23 | 3 | 17 | 3 | 84 | |
| SRP_00079 | 0.54 | 0.33 | 0.88 | 29 | 41872 | 6 | 0 | 4 | 2 | 59 | |
| SRP_00124 | 0.15 | 0.09 | 0.24 | 8 | 37094 | 27 | 3 | 23 | 1 | 77 | |
| SRP_00182 | 0.59 | 0.35 | 1.00 | 35 | 46021 | 1 | 0 | 0 | 1 | 66 | |
| SRP_00197 | 0.47 | 0.28 | 0.80 | 28 | 49420 | 8 | 0 | 7 | 1 | 73 | |
| SRP_00198 | 0.47 | 0.27 | 0.82 | 28 | 51006 | 7 | 0 | 6 | 1 | 75 | |
| SRP_00199 | 0.47 | 0.24 | 0.93 | 25 | 51013 | 3 | 0 | 2 | 1 | 80 | |
| SRP_00202 | 0.48 | 0.25 | 0.94 | 29 | 54254 | 2 | 0 | 2 | 0 | 88 | |
| SRP_00241 | 0.51 | 0.33 | 0.79 | 27 | 46022 | 9 | 0 | 7 | 2 | 55 | |
| SRP_00255 | 0.65 | 0.43 | 1.00 | 40 | 47546 | 2 | 0 | 0 | 2 | 54 | |
| SRP_00260 | 0.21 | 0.14 | 0.33 | 14 | 47852 | 29 | 1 | 28 | 0 | 86 | |
| SRP_00278 | 0.53 | 0.30 | 0.94 | 31 | 46023 | 3 | 0 | 2 | 1 | 74 | |
| SRP_00322 | 0.44 | 0.25 | 0.79 | 27 | 48482 | 8 | 0 | 7 | 1 | 82 | |
| SRP_00328 | 0.49 | 0.34 | 0.71 | 29 | 39580 | 16 | 1 | 11 | 4 | 56 | |
| SRP_00329 | 0.50 | 0.34 | 0.73 | 29 | 39863 | 16 | 0 | 11 | 5 | 56 | |
| SRP_00339 | 0.49 | 0.32 | 0.77 | 30 | 44512 | 9 | 0 | 9 | 0 | 64 | |
| SRP_00340 | 0.44 | 0.27 | 0.73 | 22 | 41298 | 12 | 0 | 8 | 4 | 60 |
Matthews Correlation Coeffient, Sensitivity and Positive Predictive Value have been calculated based on the paper by Gardener & Giegerich, 2004.