
| | ||||||||||||||
| ||||||||||||||
Table of contents:
- Overview
- Performance Plots
- Performance of PETfold_pre2.0(20) - scored higher in this pairwise comparison
- Performance of CRWrnafold - scored lower in this pairwise comparison
- Compile and download dataset for PETfold_pre2.0(20) & CRWrnafold [.zip] - may take several seconds...
Overview
| Metric | PETfold_pre2.0(20) | CRWrnafold | |
|---|---|---|---|
| MCC | 0.834 | > | 0.537 |
| Average MCC ± 95% Confidence Intervals | 0.834 ± 0.011 | > | 0.534 ± 0.052 |
| Sensitivity | 0.819 | > | 0.529 |
| Positive Predictive Value | 0.850 | > | 0.545 |
| Total TP | 9338 | > | 6032 |
| Total TN | 27682286 | > | 27682205 |
| Total FP | 2367 | < | 5577 |
| Total FP CONTRA | 323 | < | 666 |
| Total FP INCONS | 1330 | < | 4374 |
| Total FP COMP | 714 | > | 537 |
| Total FN | 2062 | < | 5368 |
| P-value | 5.19332990918e-08 | ||
Performance plots
-
Comparison of performance of PETfold_pre2.0(20) and CRWrnafold. Positive Predictive Value (PPV) is plotted against sensitivity. Each dot represents a single test of each method. See tables below for raw data (individual counts for PETfold_pre2.0(20) and CRWrnafold).

-
Average Matthews Correlation Coefficients (MCC) with 95% confidence intervals (CIs) were plotted for different RNA families, for which at least 3 members were present in the benchmarking dataset. 'n' denotes the number of MCCs used to calculate the average and CI. See tables below for raw data (individual counts for PETfold_pre2.0(20) and CRWrnafold).

-
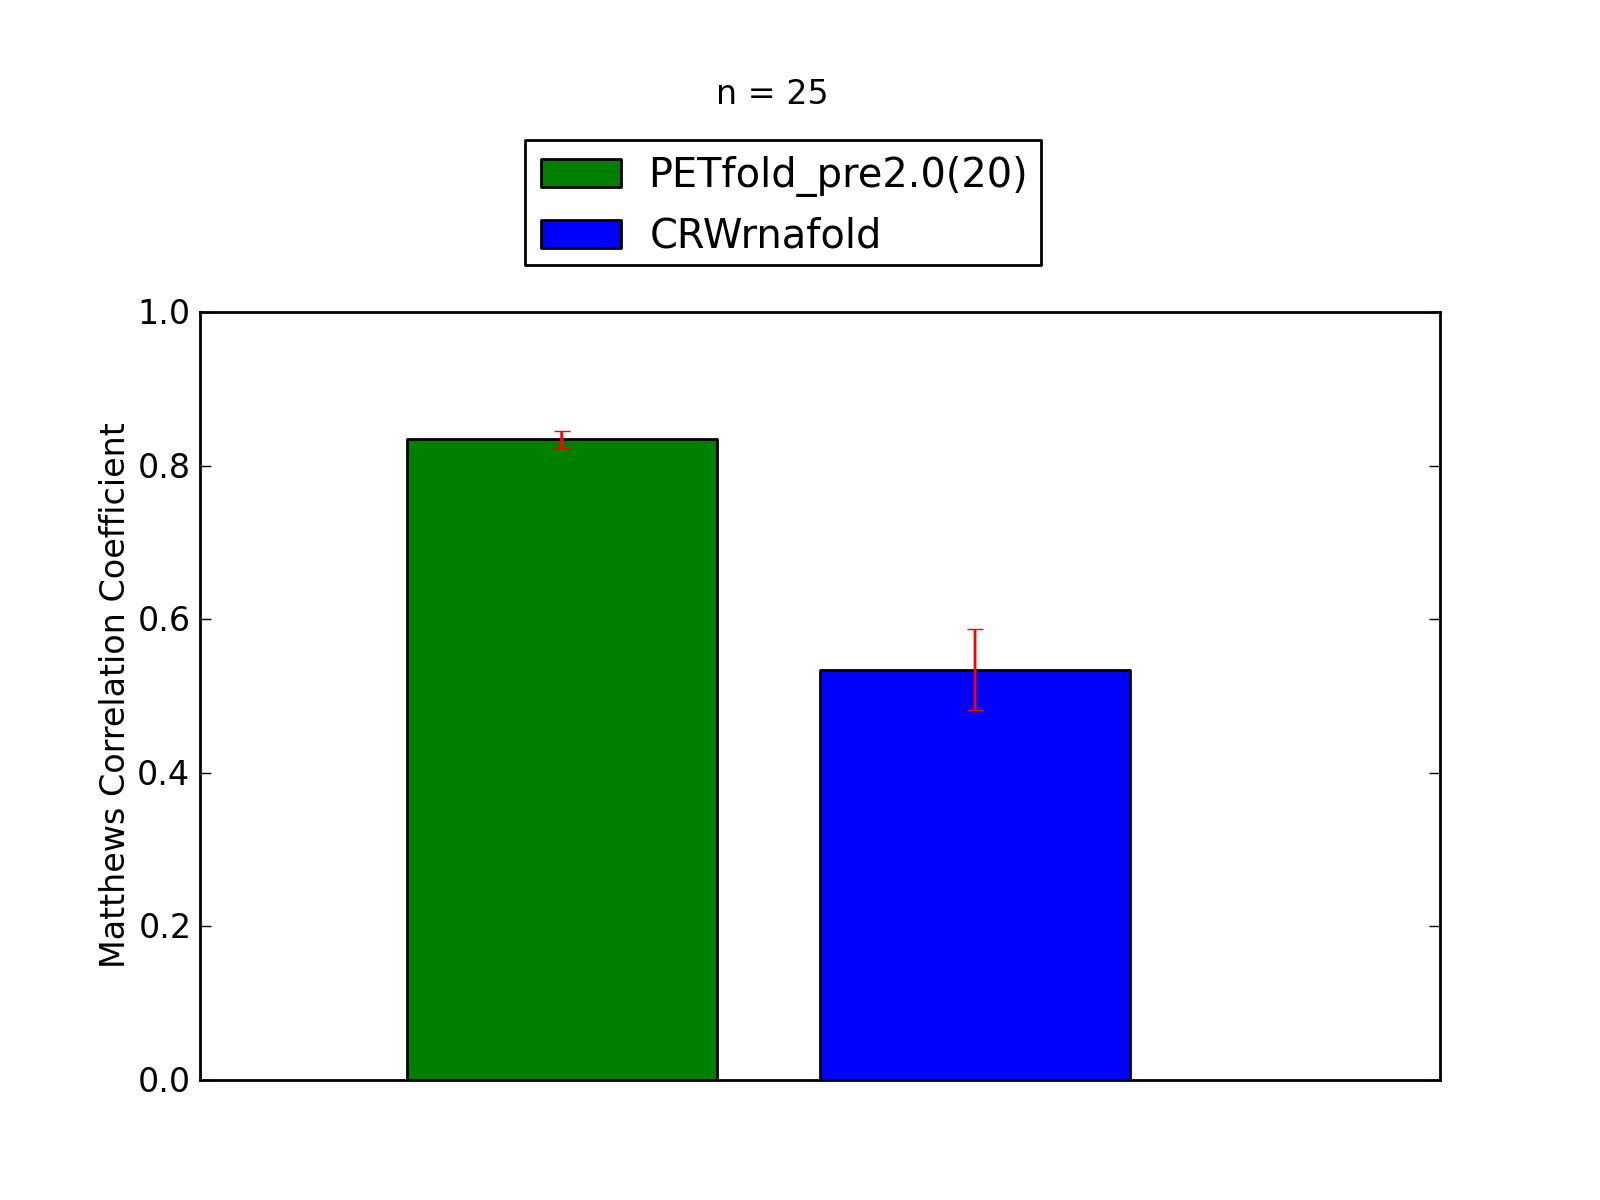
Comparison of average Matthews Correlation Coefficients (MCCs) for PETfold_pre2.0(20) and CRWrnafold. The whiskers correspond to 95% confidence intervals (CIs). 'n' denotes the number of MCCs used to calculate average MCCs and CIs. See tables below for raw data (individual counts for PETfold_pre2.0(20) and CRWrnafold).
Performance of PETfold_pre2.0(20) - scored higher in this pairwise comparison
1. Total counts & total scores for PETfold_pre2.0(20)
| Total Base Pair Counts | |
|---|---|
| Total TP | 9338 |
| Total TN | 27682286 |
| Total FP | 2367 |
| Total FP CONTRA | 323 |
| Total FP INCONS | 1330 |
| Total FP COMP | 714 |
| Total FN | 2062 |
| Total Scores | |
|---|---|
| MCC | 0.834 |
| Average MCC ± 95% Confidence Intervals | 0.834 ± 0.011 |
| Sensitivity | 0.819 |
| Positive Predictive Value | 0.850 |
| Nr of predictions | 25 |
2. Individual counts for PETfold_pre2.0(20) [ download as .csv ]
| RNA Chain | Rfam family | MCC | SENS | PPV | TP | TN | FP | FP CONTRA | FP INCONS | FP COMP | FN |
| CRW_00054 | 0.84 | 0.84 | 0.84 | 381 | 1107361 | 95 | 17 | 57 | 21 | 75 | |
| CRW_00068 | 0.84 | 0.84 | 0.84 | 383 | 1108851 | 87 | 16 | 55 | 16 | 74 | |
| CRW_00140 | 0.85 | 0.84 | 0.86 | 388 | 1135827 | 85 | 15 | 48 | 22 | 75 | |
| CRW_00173 | 0.80 | 0.80 | 0.81 | 354 | 1082220 | 107 | 18 | 64 | 25 | 91 | |
| CRW_00245 | 0.87 | 0.86 | 0.87 | 390 | 1105881 | 79 | 17 | 40 | 22 | 63 | |
| CRW_00270 | 0.86 | 0.86 | 0.86 | 390 | 1111833 | 85 | 15 | 48 | 22 | 65 | |
| CRW_00271 | 0.82 | 0.81 | 0.84 | 375 | 1122302 | 98 | 14 | 60 | 24 | 87 | |
| CRW_00273 | 0.84 | 0.84 | 0.84 | 375 | 1085156 | 94 | 14 | 56 | 24 | 71 | |
| CRW_00275 | 0.86 | 0.86 | 0.87 | 391 | 1114821 | 86 | 15 | 44 | 27 | 66 | |
| CRW_00277 | 0.84 | 0.84 | 0.85 | 379 | 1110348 | 89 | 16 | 52 | 21 | 74 | |
| CRW_00278 | 0.84 | 0.82 | 0.86 | 371 | 1129827 | 85 | 12 | 46 | 27 | 79 | |
| CRW_00280 | 0.85 | 0.85 | 0.86 | 384 | 1117811 | 93 | 15 | 50 | 28 | 69 | |
| CRW_00281 | 0.84 | 0.82 | 0.85 | 381 | 1144895 | 89 | 14 | 51 | 24 | 83 | |
| CRW_00284 | 0.84 | 0.82 | 0.85 | 376 | 1131317 | 94 | 16 | 51 | 27 | 80 | |
| CRW_00285 | 0.84 | 0.83 | 0.86 | 380 | 1117816 | 91 | 17 | 47 | 27 | 78 | |
| CRW_00466 | 0.85 | 0.85 | 0.85 | 388 | 1116310 | 90 | 13 | 54 | 23 | 70 | |
| CRW_00589 | 0.84 | 0.82 | 0.86 | 367 | 1094034 | 98 | 8 | 51 | 39 | 78 | |
| CRW_00590 | 0.87 | 0.84 | 0.89 | 381 | 1119329 | 87 | 4 | 42 | 41 | 71 | |
| CRW_00591 | 0.85 | 0.84 | 0.86 | 373 | 1098469 | 103 | 7 | 54 | 42 | 73 | |
| CRW_00772 | 0.78 | 0.76 | 0.80 | 306 | 945618 | 127 | 7 | 69 | 51 | 98 | |
| CRW_00789 | 0.82 | 0.80 | 0.85 | 357 | 1137365 | 108 | 8 | 56 | 44 | 90 | |
| CRW_00849 | 0.80 | 0.78 | 0.82 | 366 | 1117816 | 101 | 14 | 64 | 23 | 104 | |
| CRW_00997 | 0.85 | 0.84 | 0.85 | 389 | 1135822 | 85 | 16 | 51 | 18 | 75 | |
| PDB_00703 | 0.78 | 0.72 | 0.84 | 355 | 1073423 | 101 | 6 | 61 | 34 | 140 | |
| PDB_01273 | 0.78 | 0.73 | 0.84 | 358 | 1117834 | 110 | 9 | 59 | 42 | 133 |
Performance of CRWrnafold - scored lower in this pairwise comparison
1. Total counts & total scores for CRWrnafold
| Total Base Pair Counts | |
|---|---|
| Total TP | 6032 |
| Total TN | 27682205 |
| Total FP | 5577 |
| Total FP CONTRA | 666 |
| Total FP INCONS | 4374 |
| Total FP COMP | 537 |
| Total FN | 5368 |
| Total Scores | |
|---|---|
| MCC | 0.537 |
| Average MCC ± 95% Confidence Intervals | 0.534 ± 0.052 |
| Sensitivity | 0.529 |
| Positive Predictive Value | 0.545 |
| Nr of predictions | 25 |
2. Individual counts for CRWrnafold [ download as .csv ]
| RNA Chain | Rfam family | MCC | SENS | PPV | TP | TN | FP | FP CONTRA | FP INCONS | FP COMP | FN |
| CRW_00054 | 0.57 | 0.56 | 0.57 | 257 | 1107367 | 210 | 22 | 170 | 18 | 199 | |
| CRW_00068 | 0.57 | 0.57 | 0.58 | 259 | 1108856 | 209 | 20 | 170 | 19 | 198 | |
| CRW_00140 | 0.49 | 0.49 | 0.48 | 226 | 1135811 | 256 | 30 | 211 | 15 | 237 | |
| CRW_00173 | 0.38 | 0.38 | 0.39 | 168 | 1082220 | 282 | 31 | 237 | 14 | 277 | |
| CRW_00245 | 0.53 | 0.53 | 0.54 | 240 | 1105883 | 225 | 26 | 179 | 20 | 213 | |
| CRW_00270 | 0.49 | 0.49 | 0.50 | 225 | 1111832 | 246 | 27 | 202 | 17 | 230 | |
| CRW_00271 | 0.69 | 0.67 | 0.71 | 311 | 1122312 | 152 | 21 | 107 | 24 | 151 | |
| CRW_00273 | 0.41 | 0.41 | 0.41 | 181 | 1085155 | 279 | 39 | 226 | 14 | 265 | |
| CRW_00275 | 0.65 | 0.65 | 0.66 | 296 | 1114820 | 177 | 28 | 127 | 22 | 161 | |
| CRW_00277 | 0.44 | 0.43 | 0.44 | 196 | 1110351 | 263 | 35 | 213 | 15 | 257 | |
| CRW_00278 | 0.41 | 0.40 | 0.42 | 182 | 1129824 | 270 | 20 | 230 | 20 | 268 | |
| CRW_00280 | 0.67 | 0.66 | 0.68 | 299 | 1117818 | 160 | 18 | 125 | 17 | 154 | |
| CRW_00281 | 0.60 | 0.59 | 0.61 | 274 | 1144893 | 197 | 27 | 147 | 23 | 190 | |
| CRW_00284 | 0.51 | 0.50 | 0.51 | 228 | 1131314 | 245 | 27 | 191 | 27 | 228 | |
| CRW_00285 | 0.68 | 0.67 | 0.69 | 305 | 1117819 | 160 | 25 | 111 | 24 | 153 | |
| CRW_00466 | 0.71 | 0.70 | 0.71 | 320 | 1116316 | 158 | 22 | 107 | 29 | 138 | |
| CRW_00589 | 0.35 | 0.34 | 0.36 | 153 | 1094035 | 290 | 40 | 232 | 18 | 292 | |
| CRW_00590 | 0.61 | 0.59 | 0.64 | 268 | 1119334 | 184 | 21 | 133 | 30 | 184 | |
| CRW_00591 | 0.56 | 0.56 | 0.56 | 249 | 1098461 | 218 | 30 | 163 | 25 | 197 | |
| CRW_00772 | 0.19 | 0.18 | 0.19 | 74 | 945610 | 325 | 42 | 274 | 9 | 330 | |
| CRW_00789 | 0.51 | 0.50 | 0.52 | 224 | 1137356 | 236 | 32 | 174 | 30 | 223 | |
| CRW_00849 | 0.47 | 0.47 | 0.47 | 222 | 1117790 | 269 | 18 | 230 | 21 | 248 | |
| CRW_00997 | 0.69 | 0.69 | 0.69 | 318 | 1135820 | 167 | 27 | 113 | 27 | 146 | |
| PDB_00703 | 0.65 | 0.61 | 0.69 | 304 | 1073402 | 166 | 18 | 121 | 27 | 191 | |
| PDB_01273 | 0.54 | 0.52 | 0.56 | 253 | 1117806 | 233 | 20 | 181 | 32 | 238 |
Matthews Correlation Coeffient, Sensitivity and Positive Predictive Value have been calculated based on the paper by Gardener & Giegerich, 2004.