
| | ||||||||||||||
| ||||||||||||||
Table of contents:
- Overview
- Performance Plots
- Performance of PETfold_pre2.0(seed) - scored higher in this pairwise comparison
- Performance of Mastr(20) - scored lower in this pairwise comparison
- Compile and download dataset for PETfold_pre2.0(seed) & Mastr(20) [.zip] - may take several seconds...
Overview
| Metric | PETfold_pre2.0(seed) | Mastr(20) | |
|---|---|---|---|
| MCC | 0.644 | > | 0.000 |
| Average MCC ± 95% Confidence Intervals | 0.645 ± 0.015 | > | 0.000 ± 0.000 |
| Sensitivity | 0.610 | > | 0.000 |
| Positive Predictive Value | 0.680 | > | 0.000 |
| Total TP | 8150 | > | 0 |
| Total TN | 44596740 | < | 44608726 |
| Total FP | 5678 | > | 0 |
| Total FP CONTRA | 411 | > | 0 |
| Total FP INCONS | 3425 | > | 0 |
| Total FP COMP | 1842 | > | 0 |
| Total FN | 5210 | < | 13360 |
| P-value | 5.19332990918e-08 | ||
Performance plots
-
Comparison of performance of PETfold_pre2.0(seed) and Mastr(20). Positive Predictive Value (PPV) is plotted against sensitivity. Each dot represents a single test of each method. See tables below for raw data (individual counts for PETfold_pre2.0(seed) and Mastr(20)).

-
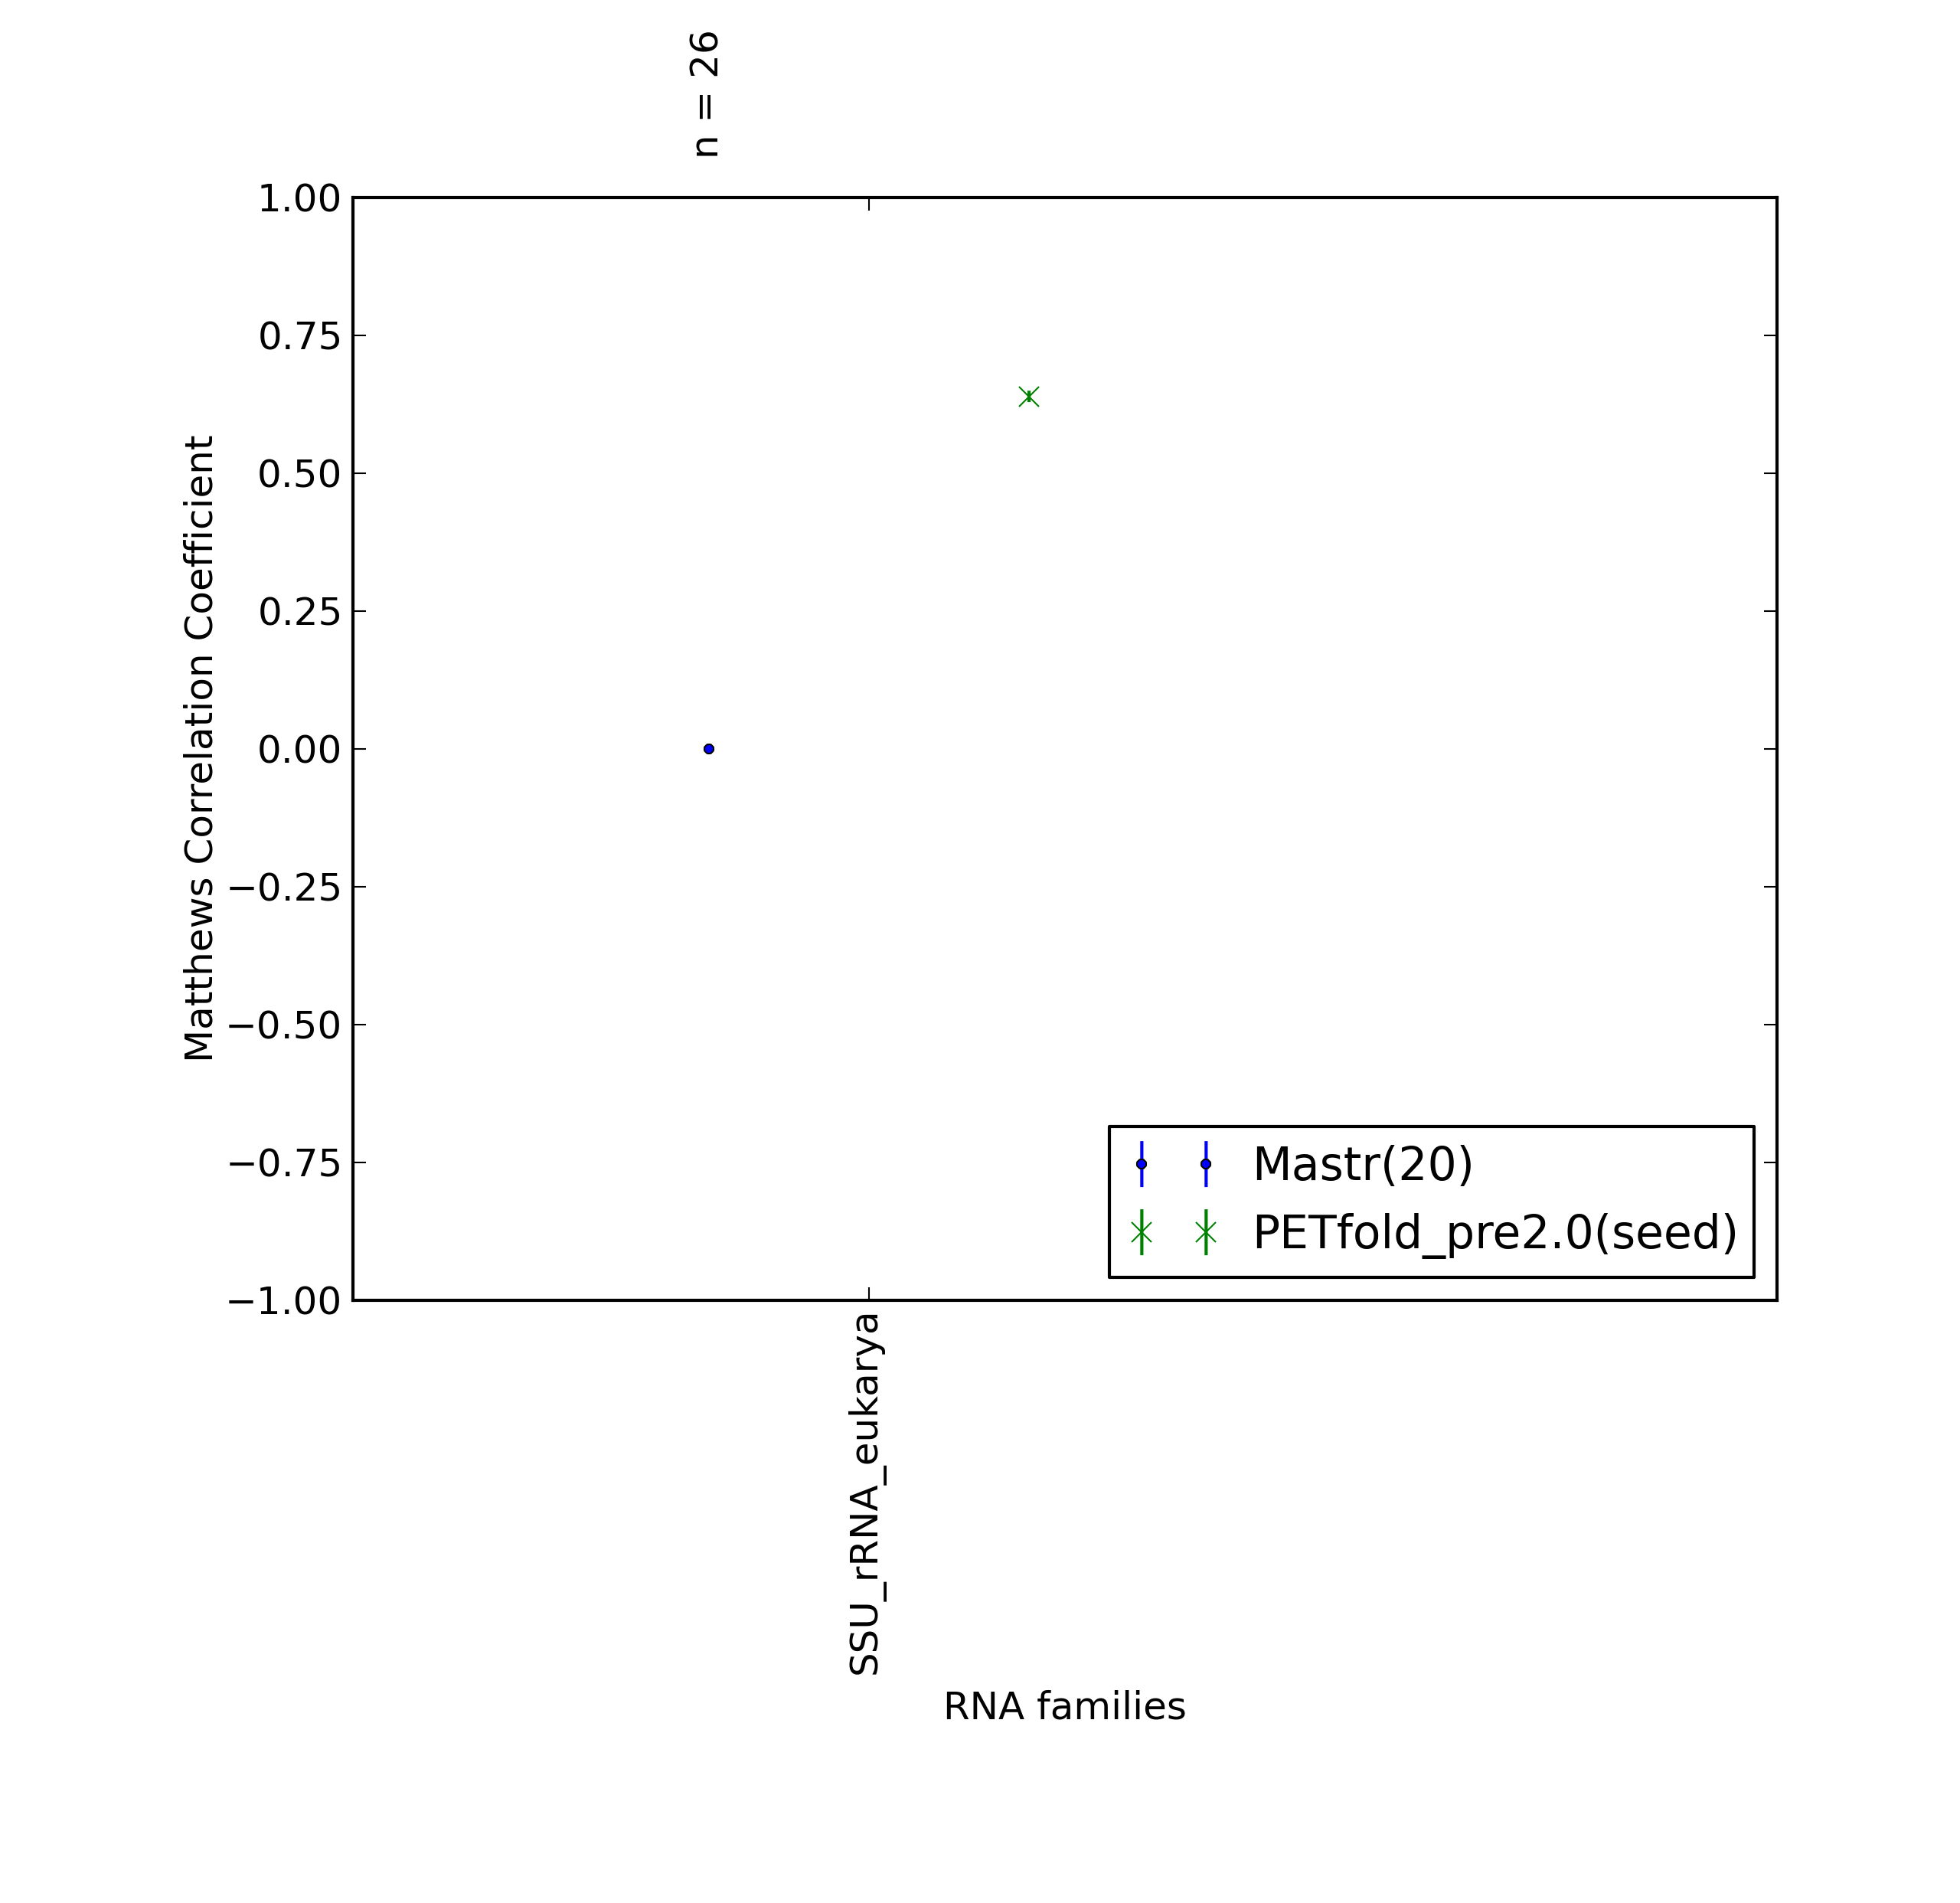
Average Matthews Correlation Coefficients (MCC) with 95% confidence intervals (CIs) were plotted for different RNA families, for which at least 3 members were present in the benchmarking dataset. 'n' denotes the number of MCCs used to calculate the average and CI. See tables below for raw data (individual counts for PETfold_pre2.0(seed) and Mastr(20)).
-
Comparison of average Matthews Correlation Coefficients (MCCs) for PETfold_pre2.0(seed) and Mastr(20). The whiskers correspond to 95% confidence intervals (CIs). 'n' denotes the number of MCCs used to calculate average MCCs and CIs. See tables below for raw data (individual counts for PETfold_pre2.0(seed) and Mastr(20)).

Performance of PETfold_pre2.0(seed) - scored higher in this pairwise comparison
1. Total counts & total scores for PETfold_pre2.0(seed)
| Total Base Pair Counts | |
|---|---|
| Total TP | 8150 |
| Total TN | 44596740 |
| Total FP | 5678 |
| Total FP CONTRA | 411 |
| Total FP INCONS | 3425 |
| Total FP COMP | 1842 |
| Total FN | 5210 |
| Total Scores | |
|---|---|
| MCC | 0.644 |
| Average MCC ± 95% Confidence Intervals | 0.645 ± 0.015 |
| Sensitivity | 0.610 |
| Positive Predictive Value | 0.680 |
| Nr of predictions | 27 |
2. Individual counts for PETfold_pre2.0(seed) [ download as .csv ]
| RNA Chain | Rfam family | MCC | SENS | PPV | TP | TN | FP | FP CONTRA | FP INCONS | FP COMP | FN |
| CRW_00298 | 0.66 | 0.63 | 0.69 | 310 | 1620452 | 212 | 16 | 122 | 74 | 184 | |
| CRW_00301 | 0.63 | 0.59 | 0.67 | 307 | 1762046 | 213 | 15 | 135 | 63 | 212 | |
| CRW_00306 | 0.68 | 0.66 | 0.70 | 305 | 1445417 | 186 | 15 | 113 | 58 | 157 | |
| CRW_00310 | 0.63 | 0.59 | 0.68 | 305 | 1805503 | 209 | 14 | 128 | 67 | 216 | |
| CRW_00326 | 0.66 | 0.63 | 0.69 | 315 | 1627654 | 205 | 15 | 126 | 64 | 187 | |
| CRW_00330 | 0.64 | 0.59 | 0.69 | 307 | 1988567 | 210 | 13 | 128 | 69 | 210 | |
| CRW_00332 | 0.60 | 0.56 | 0.63 | 269 | 1769595 | 236 | 16 | 141 | 79 | 208 | |
| CRW_00333 | 0.58 | 0.52 | 0.64 | 269 | 1892065 | 217 | 19 | 132 | 66 | 245 | |
| CRW_00345 | 0.64 | 0.61 | 0.67 | 305 | 1586418 | 211 | 15 | 133 | 63 | 193 | |
| CRW_00346 | 0.65 | 0.61 | 0.69 | 308 | 1584644 | 204 | 15 | 123 | 66 | 193 | |
| CRW_00348 | 0.65 | 0.62 | 0.68 | 312 | 1615046 | 210 | 15 | 130 | 65 | 191 | |
| CRW_00358 | 0.64 | 0.60 | 0.67 | 306 | 1674911 | 213 | 16 | 132 | 65 | 201 | |
| CRW_00366 | 0.65 | 0.62 | 0.68 | 300 | 1579311 | 211 | 15 | 127 | 69 | 182 | |
| CRW_00370 | 0.65 | 0.62 | 0.69 | 313 | 1640313 | 205 | 15 | 125 | 65 | 193 | |
| CRW_00371 | 0.68 | 0.65 | 0.71 | 322 | 1611455 | 199 | 13 | 120 | 66 | 174 | |
| CRW_00372 | 0.64 | 0.61 | 0.67 | 306 | 1625847 | 221 | 14 | 139 | 68 | 192 | |
| CRW_00379 | 0.60 | 0.54 | 0.66 | 286 | 2126521 | 223 | 18 | 128 | 77 | 248 | |
| CRW_00403 | 0.68 | 0.66 | 0.70 | 306 | 1606090 | 215 | 15 | 117 | 83 | 158 | |
| CRW_00411 | 0.67 | 0.64 | 0.71 | 318 | 1615053 | 200 | 15 | 117 | 68 | 178 | |
| CRW_00598 | 0.63 | 0.60 | 0.66 | 294 | 1665777 | 224 | 19 | 135 | 70 | 197 | |
| CRW_00758 | 0.64 | 0.61 | 0.67 | 294 | 1640327 | 224 | 15 | 130 | 79 | 189 | |
| CRW_00759 | 0.65 | 0.62 | 0.68 | 297 | 1636709 | 218 | 15 | 124 | 79 | 184 | |
| CRW_00760 | 0.63 | 0.59 | 0.66 | 287 | 1638522 | 227 | 17 | 129 | 81 | 199 | |
| CRW_00772 | 0.79 | 0.76 | 0.81 | 309 | 945618 | 130 | 6 | 67 | 57 | 95 | |
| CRW_01153 | 0.61 | 0.58 | 0.64 | 294 | 1606070 | 223 | 18 | 146 | 59 | 209 | |
| CRW_01171 | 0.63 | 0.60 | 0.67 | 304 | 1593548 | 214 | 15 | 138 | 61 | 202 | |
| CRW_01300 | 0.62 | 0.59 | 0.66 | 302 | 1693261 | 218 | 17 | 140 | 61 | 213 |
Performance of Mastr(20) - scored lower in this pairwise comparison
1. Total counts & total scores for Mastr(20)
| Total Base Pair Counts | |
|---|---|
| Total TP | 0 |
| Total TN | 44608726 |
| Total FP | 0 |
| Total FP CONTRA | 0 |
| Total FP INCONS | 0 |
| Total FP COMP | 0 |
| Total FN | 13360 |
| Total Scores | |
|---|---|
| MCC | 0.000 |
| Average MCC ± 95% Confidence Intervals | 0.000 ± 0.000 |
| Sensitivity | 0.000 |
| Positive Predictive Value | 0.000 |
| Nr of predictions | 27 |
2. Individual counts for Mastr(20) [ download as .csv ]
| RNA Chain | Rfam family | MCC | SENS | PPV | TP | TN | FP | FP CONTRA | FP INCONS | FP COMP | FN |
| CRW_00298 | 0.00 | 0.00 | 0.00 | 0 | 1620900 | 0 | 0 | 0 | 0 | 494 | |
| CRW_00301 | 0.00 | 0.00 | 0.00 | 0 | 1762503 | 0 | 0 | 0 | 0 | 519 | |
| CRW_00306 | 0.00 | 0.00 | 0.00 | 0 | 1445850 | 0 | 0 | 0 | 0 | 462 | |
| CRW_00310 | 0.00 | 0.00 | 0.00 | 0 | 1805950 | 0 | 0 | 0 | 0 | 521 | |
| CRW_00326 | 0.00 | 0.00 | 0.00 | 0 | 1628110 | 0 | 0 | 0 | 0 | 502 | |
| CRW_00330 | 0.00 | 0.00 | 0.00 | 0 | 1989015 | 0 | 0 | 0 | 0 | 517 | |
| CRW_00332 | 0.00 | 0.00 | 0.00 | 0 | 1770021 | 0 | 0 | 0 | 0 | 477 | |
| CRW_00333 | 0.00 | 0.00 | 0.00 | 0 | 1892485 | 0 | 0 | 0 | 0 | 514 | |
| CRW_00345 | 0.00 | 0.00 | 0.00 | 0 | 1586871 | 0 | 0 | 0 | 0 | 498 | |
| CRW_00346 | 0.00 | 0.00 | 0.00 | 0 | 1585090 | 0 | 0 | 0 | 0 | 501 | |
| CRW_00348 | 0.00 | 0.00 | 0.00 | 0 | 1615503 | 0 | 0 | 0 | 0 | 503 | |
| CRW_00358 | 0.00 | 0.00 | 0.00 | 0 | 1675365 | 0 | 0 | 0 | 0 | 507 | |
| CRW_00366 | 0.00 | 0.00 | 0.00 | 0 | 1579753 | 0 | 0 | 0 | 0 | 482 | |
| CRW_00370 | 0.00 | 0.00 | 0.00 | 0 | 1640766 | 0 | 0 | 0 | 0 | 506 | |
| CRW_00371 | 0.00 | 0.00 | 0.00 | 0 | 1611910 | 0 | 0 | 0 | 0 | 496 | |
| CRW_00372 | 0.00 | 0.00 | 0.00 | 0 | 1626306 | 0 | 0 | 0 | 0 | 498 | |
| CRW_00379 | 0.00 | 0.00 | 0.00 | 0 | 2126953 | 0 | 0 | 0 | 0 | 534 | |
| CRW_00403 | 0.00 | 0.00 | 0.00 | 0 | 1606528 | 0 | 0 | 0 | 0 | 464 | |
| CRW_00411 | 0.00 | 0.00 | 0.00 | 0 | 1615503 | 0 | 0 | 0 | 0 | 496 | |
| CRW_00598 | 0.00 | 0.00 | 0.00 | 0 | 1666225 | 0 | 0 | 0 | 0 | 491 | |
| CRW_00758 | 0.00 | 0.00 | 0.00 | 0 | 1640766 | 0 | 0 | 0 | 0 | 483 | |
| CRW_00759 | 0.00 | 0.00 | 0.00 | 0 | 1637145 | 0 | 0 | 0 | 0 | 481 | |
| CRW_00760 | 0.00 | 0.00 | 0.00 | 0 | 1638955 | 0 | 0 | 0 | 0 | 486 | |
| CRW_00772 | 0.00 | 0.00 | 0.00 | 0 | 946000 | 0 | 0 | 0 | 0 | 404 | |
| CRW_01153 | 0.00 | 0.00 | 0.00 | 0 | 1606528 | 0 | 0 | 0 | 0 | 503 | |
| CRW_01171 | 0.00 | 0.00 | 0.00 | 0 | 1594005 | 0 | 0 | 0 | 0 | 506 | |
| CRW_01300 | 0.00 | 0.00 | 0.00 | 0 | 1693720 | 0 | 0 | 0 | 0 | 515 |
Matthews Correlation Coeffient, Sensitivity and Positive Predictive Value have been calculated based on the paper by Gardener & Giegerich, 2004.