| ASE_00064 |
RNaseP_bact_a
links to Rfam database...
|
0.52 |
0.44 |
0.61 |
39 |
45387 |
31 |
1 |
24 |
6 |
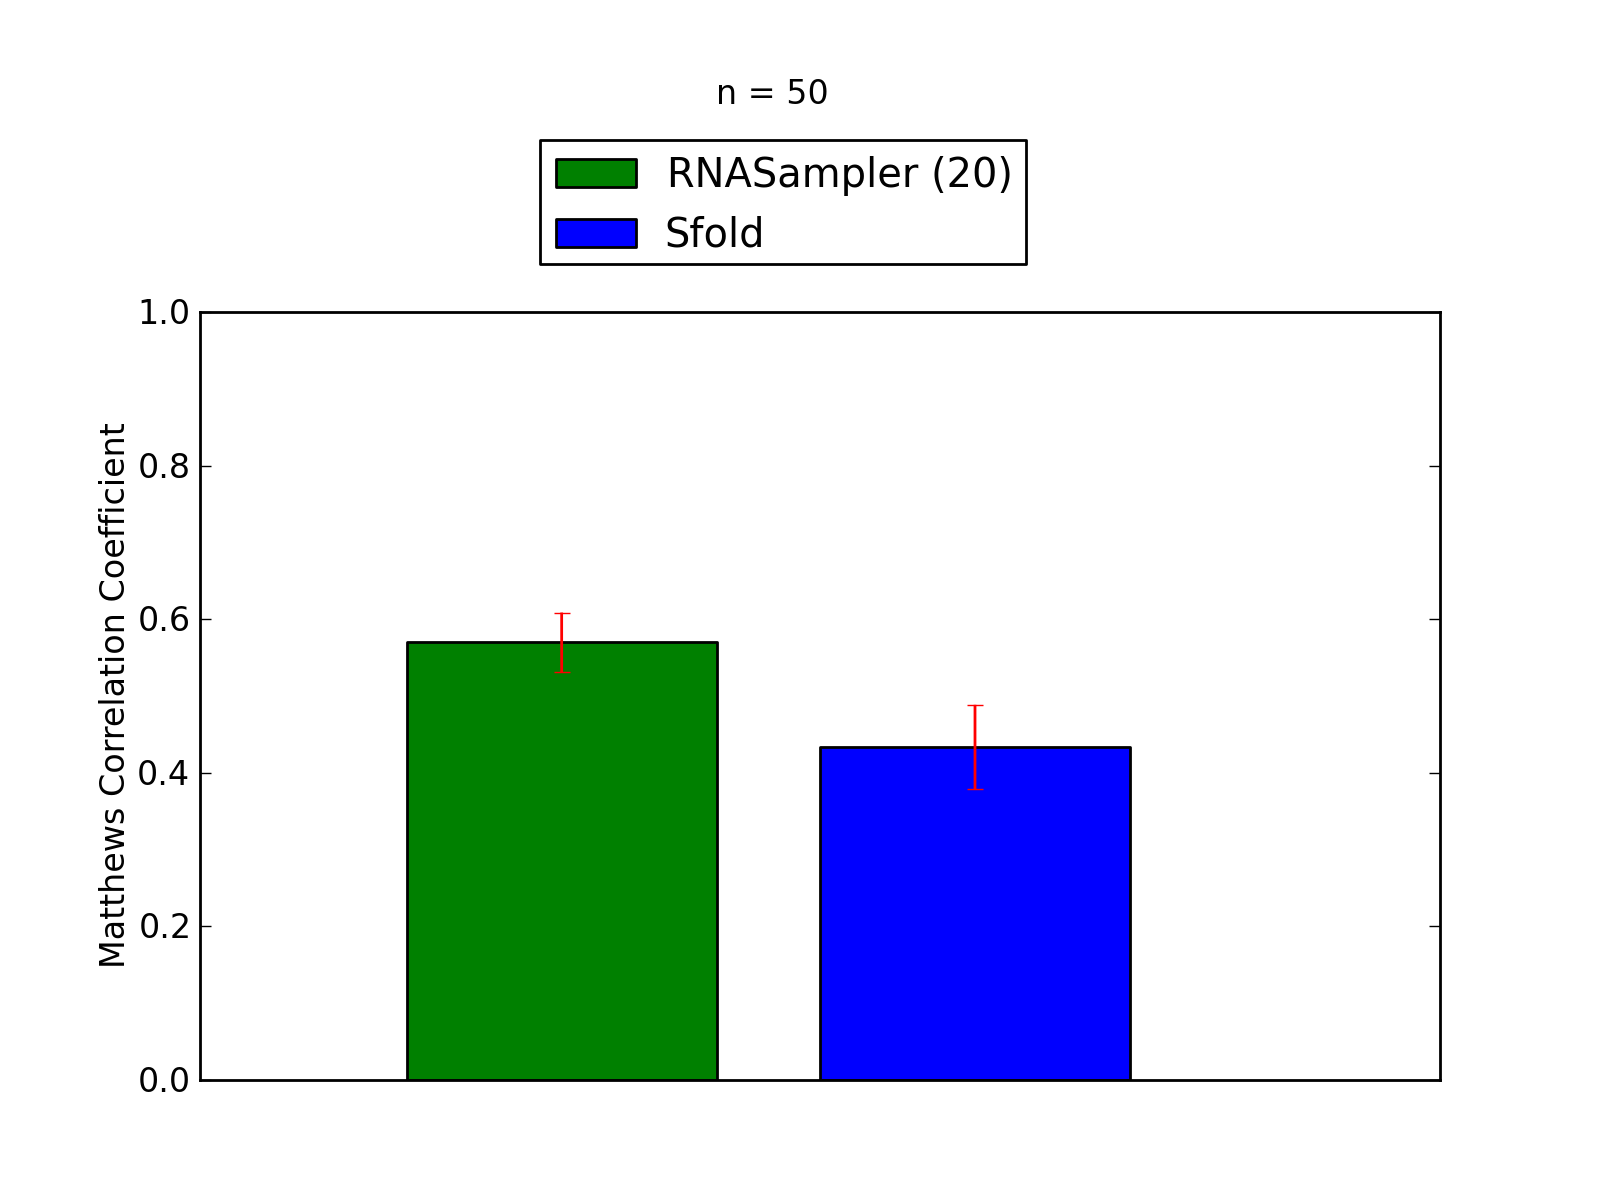
50 |
| ASE_00090 |
RNaseP_bact_a
links to Rfam database...
|
0.66 |
0.58 |
0.74 |
59 |
55531 |
22 |
1 |
20 |
1 |
42 |
| ASE_00135 |
RNaseP_bact_a
links to Rfam database...
|
0.50 |
0.45 |
0.56 |
49 |
63103 |
42 |
0 |
38 |
4 |
60 |
| ASE_00153 |
RNaseP_nuc
links to Rfam database...
|
0.69 |
0.67 |
0.70 |
49 |
57560 |
61 |
2 |
19 |
40 |
24 |
| ASE_00215 |
RNaseP_bact_a
links to Rfam database...
|
0.55 |
0.51 |
0.60 |
50 |
48432 |
37 |
4 |
30 |
3 |
49 |
| ASE_00328 |
RNaseP_bact_b
links to Rfam database...
|
0.45 |
0.41 |
0.48 |
46 |
72676 |
54 |
3 |
46 |
5 |
66 |
| ASE_00361 |
RNaseP_bact_a
links to Rfam database...
|
0.50 |
0.47 |
0.53 |
60 |
75353 |
57 |
6 |
47 |
4 |
67 |
| ASE_00441 |
RNaseP_bact_a
links to Rfam database...
|
0.78 |
0.74 |
0.81 |
83 |
64159 |
25 |
3 |
16 |
6 |
29 |
| PDB_00571 |
tRNA
links to Rfam database...
|
0.21 |
0.20 |
0.24 |
5 |
3300 |
16 |
6 |
10 |
0 |
20 |
| PDB_00828 |
Purine
links to Rfam database...
|
0.88 |
0.78 |
1.00 |
21 |
2464 |
0 |
0 |
0 |
0 |
6 |
| PDB_00829 |
Purine
links to Rfam database...
|
0.86 |
0.75 |
1.00 |
18 |
2260 |
0 |
0 |
0 |
0 |
6 |
| PDB_01020 |
Purine
links to Rfam database...
|
0.86 |
0.74 |
1.00 |
17 |
2261 |
1 |
0 |
0 |
1 |
6 |
| PDB_01073 |
SAM
links to Rfam database...
|
0.80 |
0.65 |
1.00 |
22 |
4349 |
1 |
0 |
0 |
1 |
12 |
| TMR_00017 |
tmRNA
links to Rfam database...
|
0.30 |
0.24 |
0.39 |
24 |
67100 |
43 |
5 |
32 |
6 |
78 |
| TMR_00018 |
tmRNA
links to Rfam database...
|
0.22 |
0.21 |
0.24 |
19 |
64542 |
63 |
15 |
44 |
4 |
73 |
| TMR_00042 |
tmRNA
links to Rfam database...
|
0.20 |
0.18 |
0.23 |
18 |
62757 |
63 |
8 |
52 |
3 |
80 |
| TMR_00046 |
tmRNA
links to Rfam database...
|
0.61 |
0.56 |
0.66 |
54 |
62753 |
34 |
4 |
24 |
6 |
42 |
| TMR_00048 |
tmRNA
links to Rfam database...
|
0.39 |
0.34 |
0.46 |
32 |
64911 |
46 |
2 |
35 |
9 |
63 |
| TMR_00080 |
tmRNA
links to Rfam database...
|
0.54 |
0.40 |
0.75 |
38 |
70449 |
13 |
3 |
10 |
0 |
58 |
| TMR_00082 |
tmRNA
links to Rfam database...
|
0.48 |
0.43 |
0.53 |
41 |
67819 |
38 |
11 |
25 |
2 |
55 |
| TMR_00123 |
tmRNA
links to Rfam database...
|
0.32 |
0.27 |
0.39 |
27 |
66360 |
48 |
7 |
36 |
5 |
74 |
| TMR_00137 |
tmRNA
links to Rfam database...
|
0.17 |
0.17 |
0.18 |
15 |
60992 |
78 |
7 |
61 |
10 |
74 |
| TMR_00142 |
tmRNA
links to Rfam database...
|
0.42 |
0.35 |
0.50 |
36 |
70804 |
43 |
5 |
31 |
7 |
66 |
| TMR_00207 |
tmRNA
links to Rfam database...
|
0.37 |
0.35 |
0.38 |
36 |
72296 |
65 |
3 |
55 |
7 |
67 |
| TMR_00257 |
tmRNA
links to Rfam database...
|
0.08 |
0.07 |
0.09 |
7 |
67080 |
78 |
7 |
67 |
4 |
91 |
| TMR_00271 |
tmRNA
links to Rfam database...
|
0.54 |
0.48 |
0.60 |
44 |
64188 |
33 |
6 |
23 |
4 |
47 |
| TMR_00332 |
tmRNA
links to Rfam database...
|
0.35 |
0.30 |
0.42 |
30 |
67089 |
47 |
8 |
34 |
5 |
69 |
| TMR_00366 |
tmRNA
links to Rfam database...
|
0.33 |
0.31 |
0.36 |
31 |
67809 |
68 |
11 |
45 |
12 |
69 |
| TMR_00378 |
tmRNA
links to Rfam database...
|
0.29 |
0.25 |
0.34 |
24 |
67826 |
54 |
7 |
39 |
8 |
73 |
| TMR_00404 |
tmRNA
links to Rfam database...
|
0.41 |
0.37 |
0.45 |
34 |
67453 |
52 |
15 |
26 |
11 |
58 |
| TMR_00427 |
tmRNA
links to Rfam database...
|
0.38 |
0.25 |
0.57 |
24 |
67486 |
24 |
0 |
18 |
6 |
73 |
| TMR_00443 |
tmRNA
links to Rfam database...
|
0.41 |
0.31 |
0.55 |
32 |
67103 |
35 |
5 |
21 |
9 |
72 |
| TMR_00451 |
tmRNA
links to Rfam database...
|
0.18 |
0.17 |
0.19 |
15 |
63465 |
66 |
13 |
53 |
0 |
74 |
| TMR_00458 |
tmRNA
links to Rfam database...
|
0.25 |
0.16 |
0.38 |
15 |
63507 |
32 |
4 |
20 |
8 |
78 |
| TMR_00469 |
tmRNA
links to Rfam database...
|
0.41 |
0.42 |
0.40 |
42 |
64516 |
62 |
11 |
51 |
0 |
58 |
| TMR_00472 |
tmRNA
links to Rfam database...
|
0.38 |
0.33 |
0.43 |
32 |
64546 |
45 |
12 |
30 |
3 |
65 |
| TMR_00519 |
tmRNA
links to Rfam database...
|
0.14 |
0.15 |
0.14 |
14 |
63089 |
97 |
15 |
72 |
10 |
81 |
| TMR_00520 |
tmRNA
links to Rfam database...
|
0.51 |
0.41 |
0.62 |
41 |
63124 |
35 |
7 |
18 |
10 |
58 |
| TMR_00522 |
tmRNA
links to Rfam database...
|
0.48 |
0.38 |
0.62 |
37 |
63130 |
32 |
9 |
14 |
9 |
60 |
| TMR_00528 |
tmRNA
links to Rfam database...
|
0.32 |
0.15 |
0.65 |
15 |
63167 |
18 |
3 |
5 |
10 |
82 |
| TMR_00540 |
tmRNA
links to Rfam database...
|
0.48 |
0.35 |
0.68 |
36 |
73483 |
17 |
2 |
15 |
0 |
68 |
| TMR_00568 |
tmRNA
links to Rfam database...
|
0.52 |
0.35 |
0.78 |
35 |
60681 |
18 |
0 |
10 |
8 |
64 |
| TMR_00571 |
tmRNA
links to Rfam database...
|
0.50 |
0.33 |
0.75 |
33 |
60682 |
18 |
2 |
9 |
7 |
66 |
| TMR_00580 |
tmRNA
links to Rfam database...
|
0.38 |
0.25 |
0.57 |
25 |
60682 |
24 |
3 |
16 |
5 |
75 |
| TMR_00584 |
tmRNA
links to Rfam database...
|
0.58 |
0.55 |
0.62 |
53 |
60990 |
38 |
7 |
25 |
6 |
44 |
| TMR_00586 |
tmRNA
links to Rfam database...
|
0.28 |
0.25 |
0.32 |
24 |
61001 |
54 |
12 |
38 |
4 |
73 |
| TMR_00616 |
tmRNA
links to Rfam database...
|
0.40 |
0.38 |
0.41 |
38 |
67068 |
60 |
10 |
45 |
5 |
61 |
| TMR_00699 |
tmRNA
links to Rfam database...
|
0.31 |
0.29 |
0.34 |
30 |
67072 |
61 |
6 |
53 |
2 |
72 |
| TMR_00702 |
tmRNA
links to Rfam database...
|
0.13 |
0.11 |
0.15 |
11 |
67090 |
64 |
6 |
54 |
4 |
89 |
| TMR_00703 |
tmRNA
links to Rfam database...
|
0.37 |
0.31 |
0.44 |
31 |
67457 |
44 |
7 |
33 |
4 |
68 |