Table of contents:
- Overview
- Performance Plots
- Performance of MXScarna(seed)
- scored higher in this pairwise comparison
- Performance of Carnac(seed)
- scored lower in this pairwise comparison
- Compile and download dataset for MXScarna(seed) & Carnac(seed) [.zip] - may take several seconds...
Overview
| Metric |
MXScarna(seed) |
|
Carnac(seed) |
|---|
| MCC |
0.661 |
>
|
0.404 |
| Average MCC ± 95% Confidence Intervals |
0.650
±
0.070
|
>
|
0.154
±
0.103
|
| Sensitivity |
0.560 |
>
|
0.181 |
| Positive Predictive Value |
0.781 |
<
|
0.903 |
| Total TP |
979 |
>
|
316 |
| Total TN |
1275527 |
<
|
1276431 |
| Total FP |
366 |
>
|
36 |
| Total FP CONTRA |
40 |
>
|
3 |
| Total FP INCONS |
235 |
>
|
31 |
| Total FP COMP |
91 |
>
|
2 |
| Total FN |
770 |
<
|
1433 |
| P-value |
3.56938820447e-08 |
Performance plots
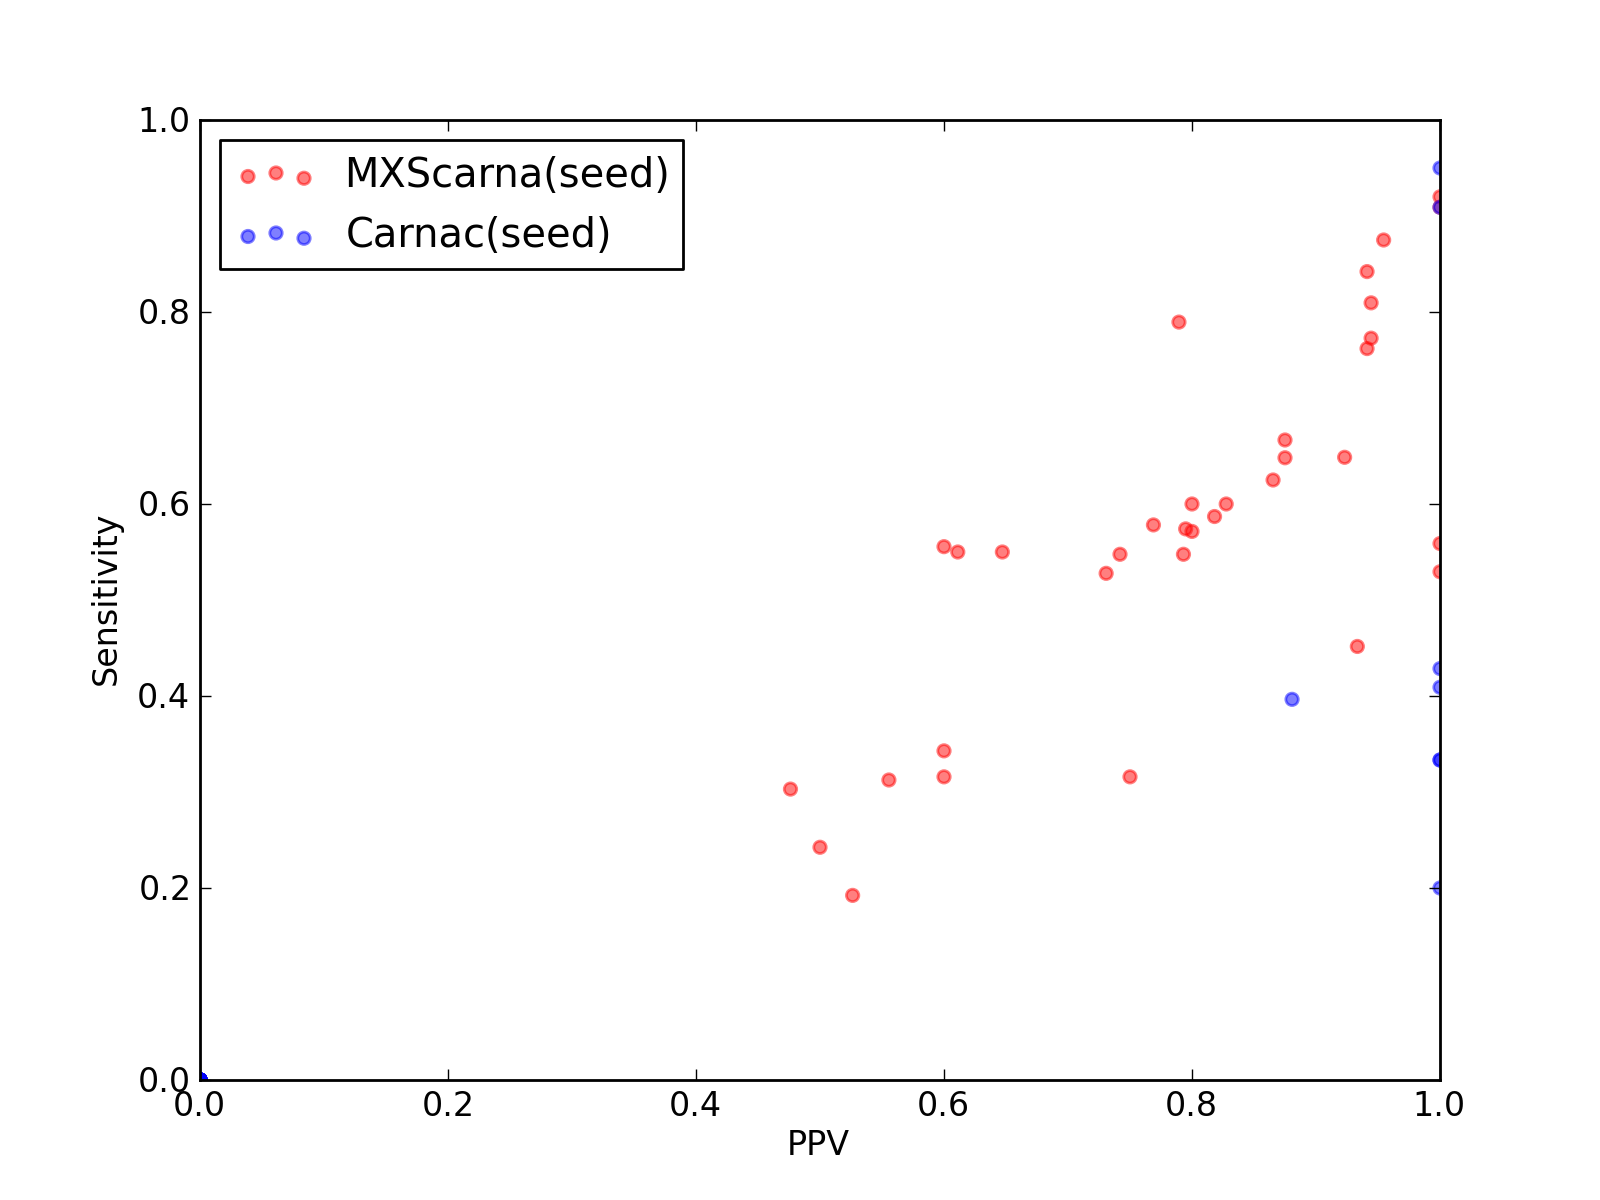
-
Comparison of performance of MXScarna(seed) and Carnac(seed). Positive Predictive Value (PPV) is plotted against sensitivity. Each dot represents a single test of each method. See tables below for raw data
(individual counts for MXScarna(seed)
and Carnac(seed)).

-
Comparison of performance of MXScarna(seed) and Carnac(seed). Positive Predictive Value (PPV) is plotted against sensitivity. Each dot represents a single test of each method. See tables below for raw data
(individual counts for MXScarna(seed)
and Carnac(seed)).
-
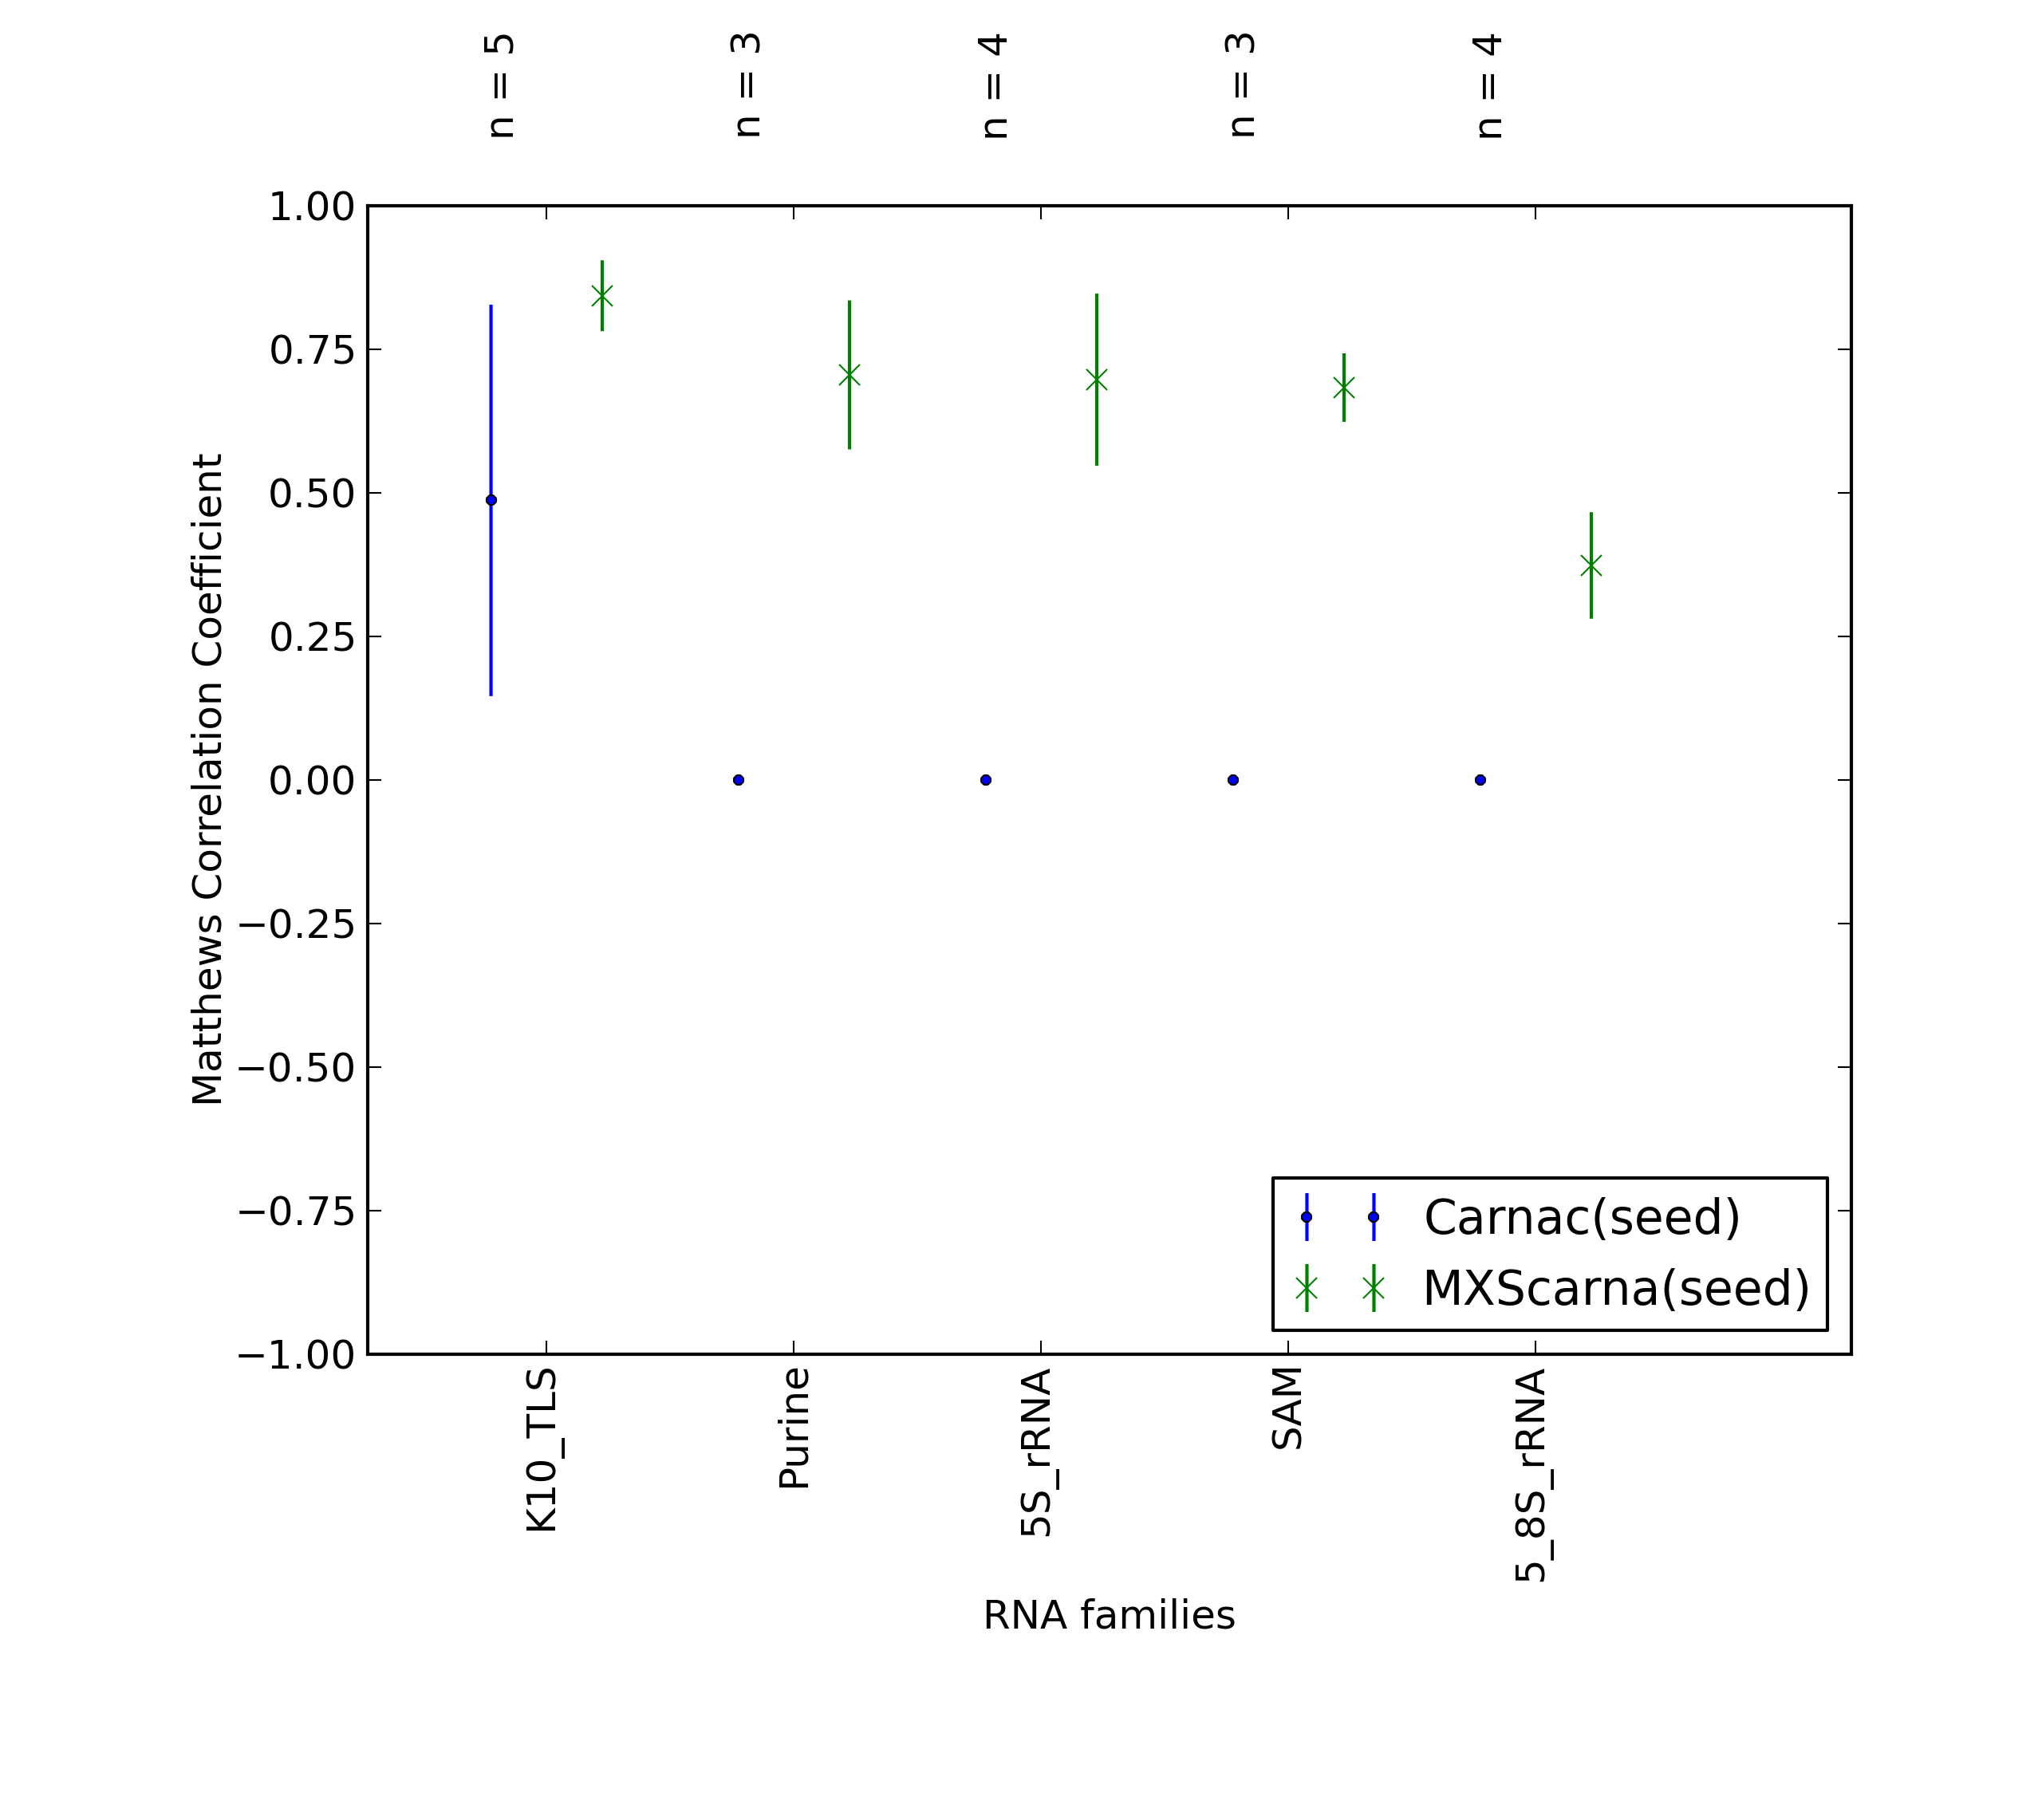
Average Matthews Correlation Coefficients (MCC) with 95% confidence intervals (CIs) were plotted for different RNA families, for which at least 3 members were present in the benchmarking dataset. 'n' denotes the number of MCCs used to calculate the average and CI. See tables below for raw data
(individual counts for MXScarna(seed)
and Carnac(seed)).
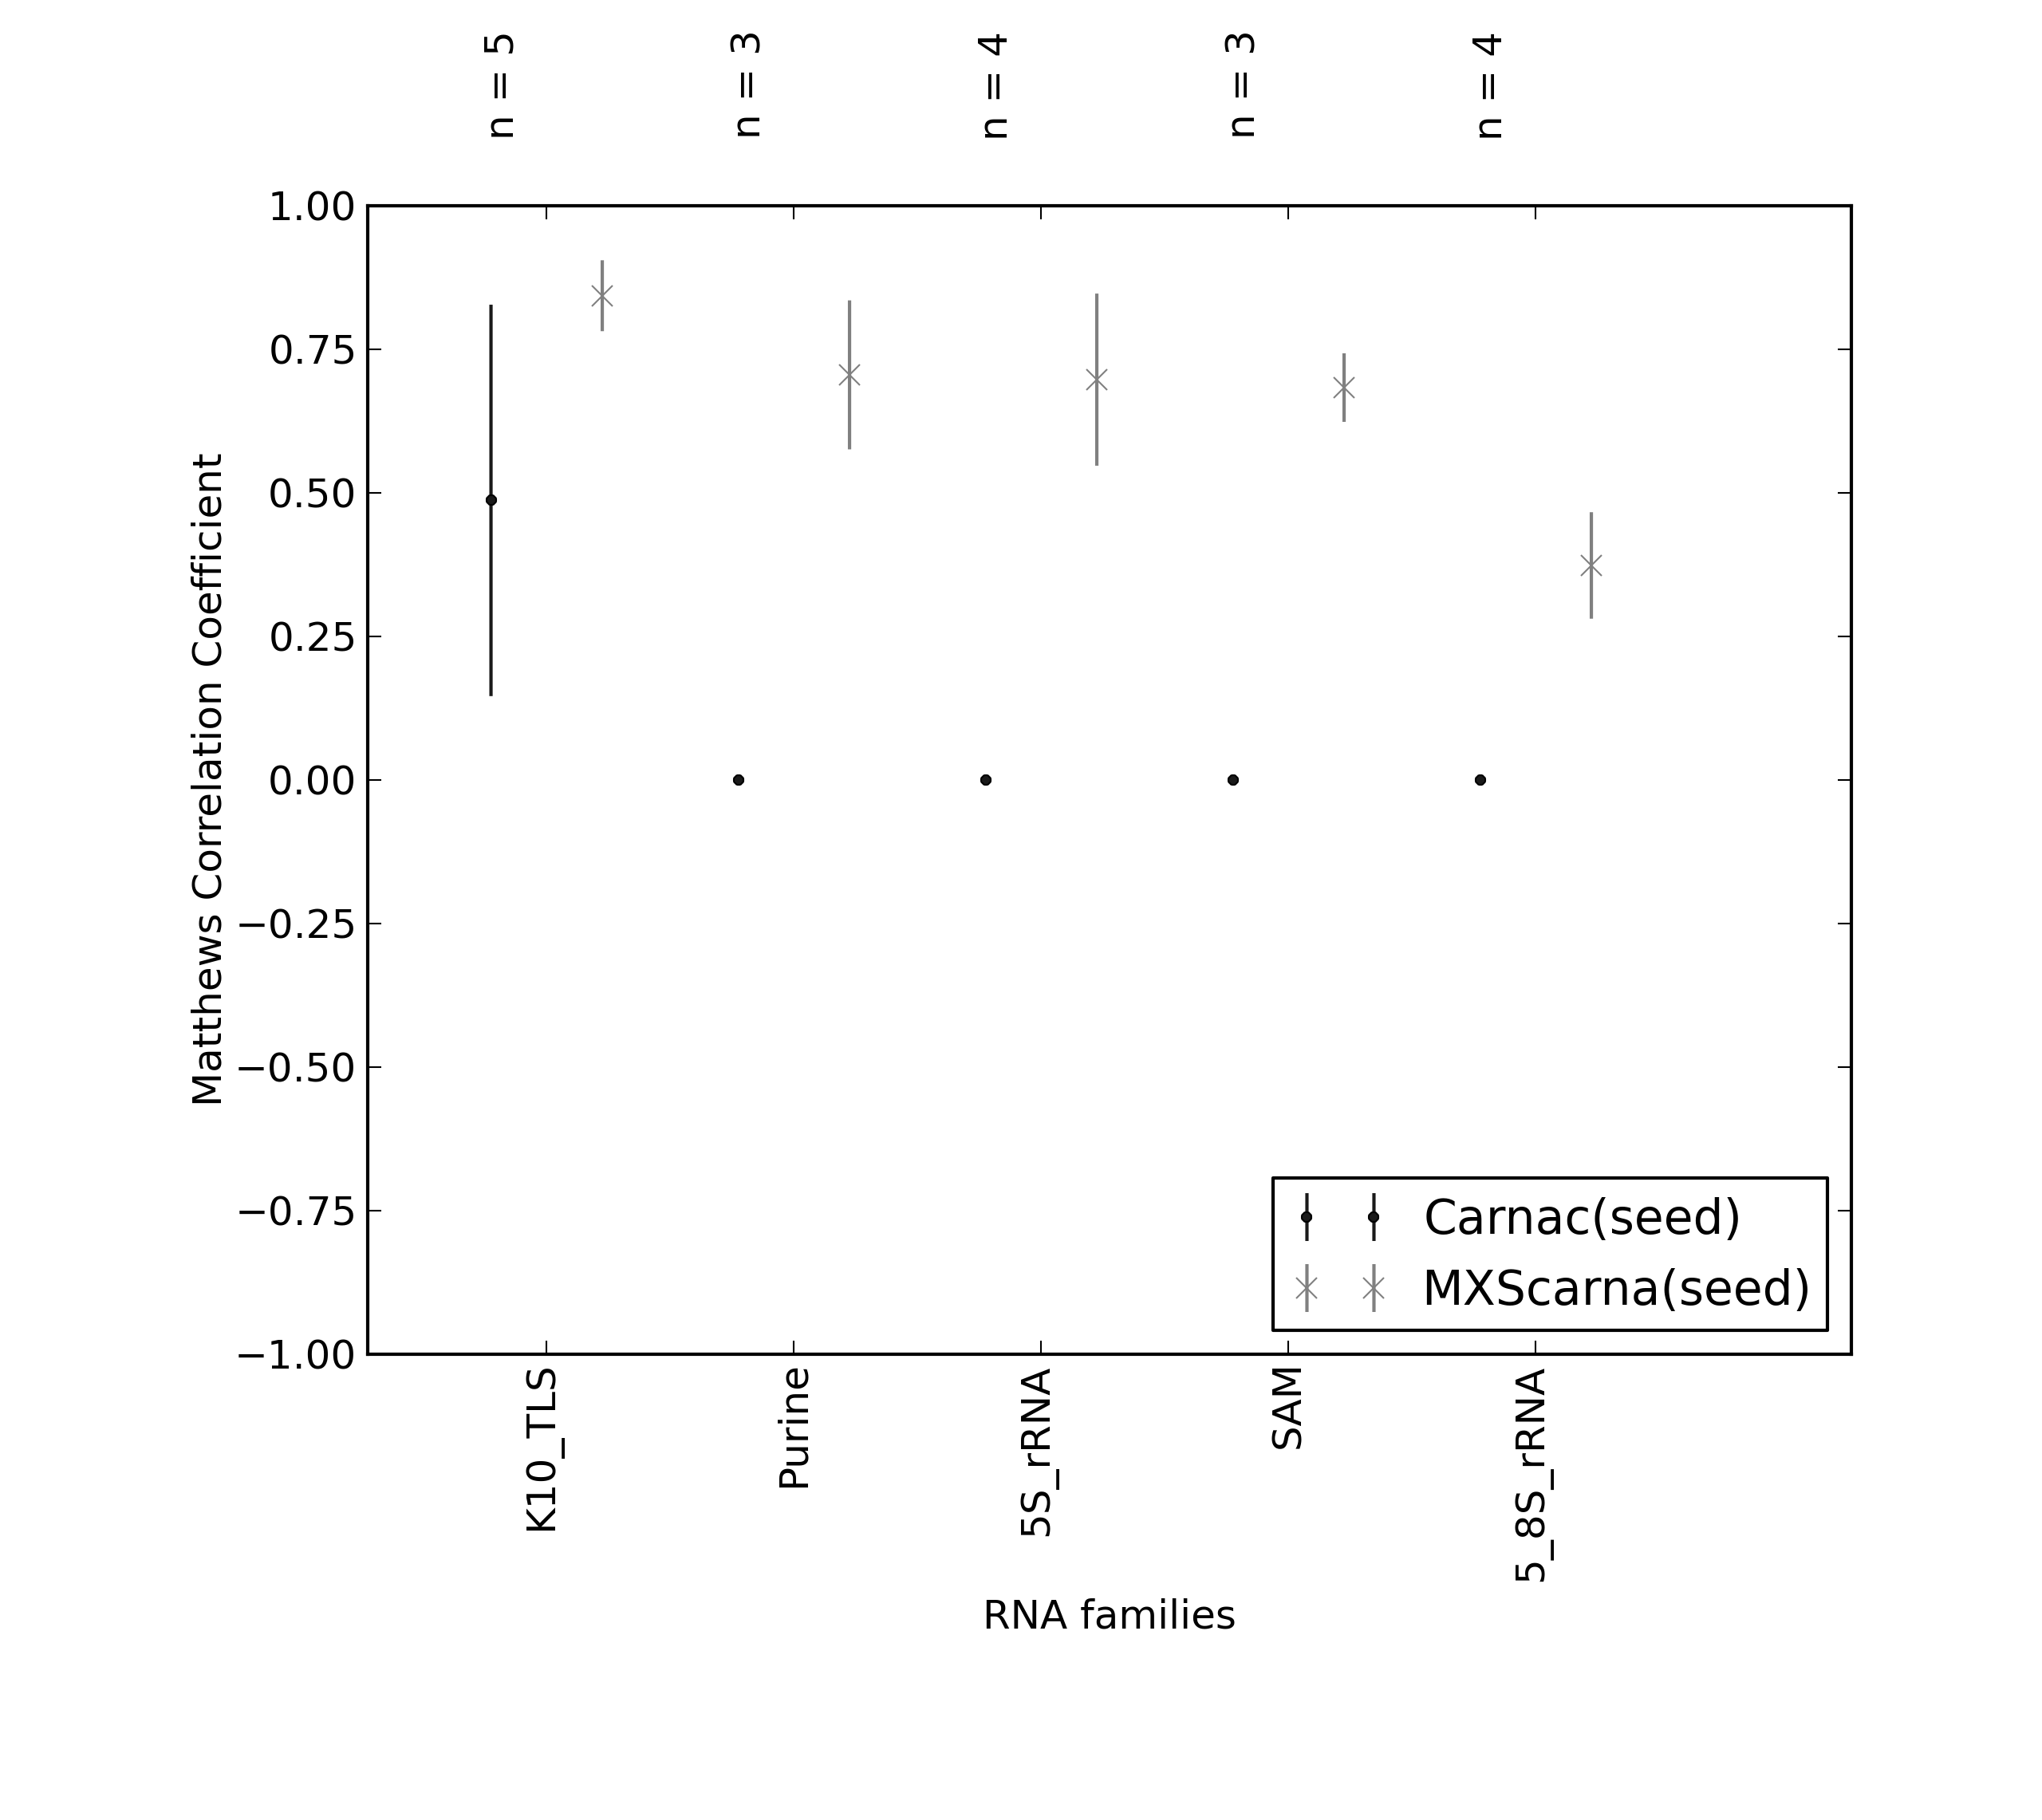
-
Average Matthews Correlation Coefficients (MCC) with 95% confidence intervals (CIs) were plotted for different RNA families, for which at least 3 members were present in the benchmarking dataset. 'n' denotes the number of MCCs used to calculate the average and CI. See tables below for raw data
(individual counts for MXScarna(seed)
and Carnac(seed)).
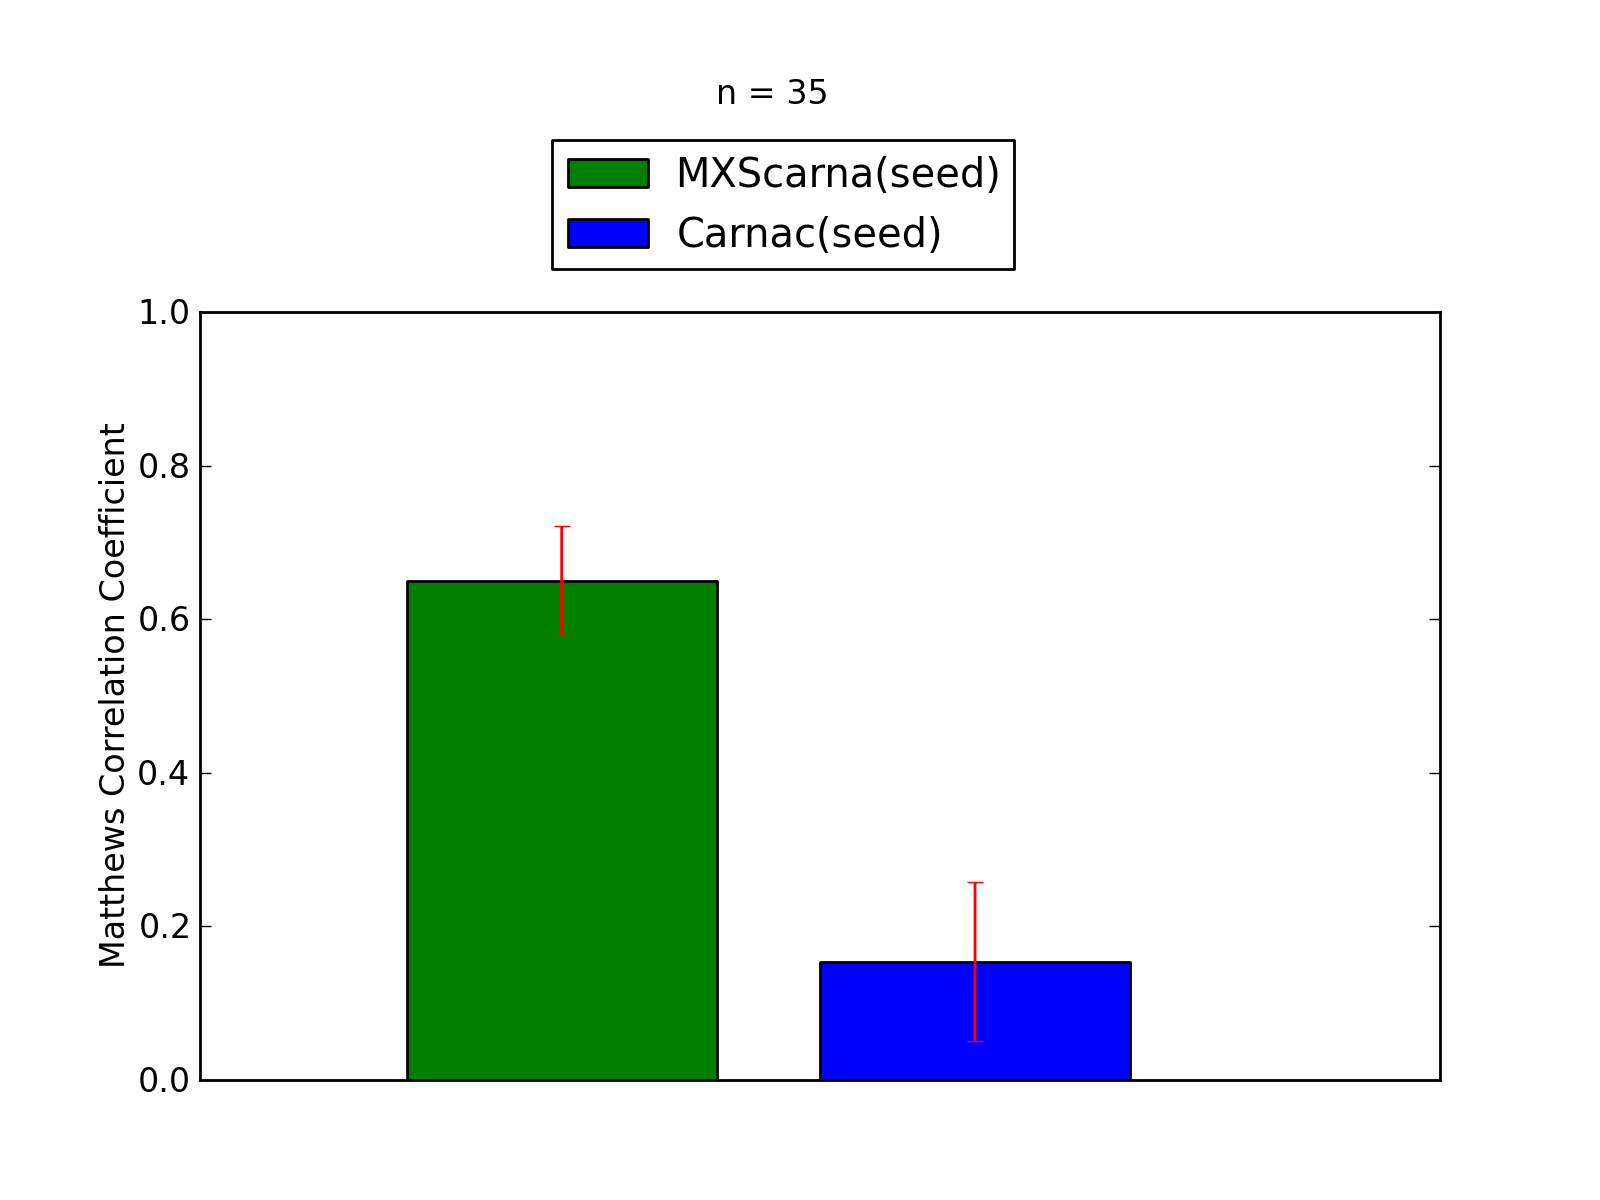
-
Comparison of average Matthews Correlation Coefficients (MCCs) for MXScarna(seed) and Carnac(seed). The whiskers correspond to 95% confidence intervals (CIs). 'n' denotes the number of MCCs used to calculate average MCCs and CIs. See tables below for raw data
(individual counts for MXScarna(seed)
and Carnac(seed)).
Performance of MXScarna(seed)
- scored higher in this pairwise comparison
1. Total counts & total scores for MXScarna(seed)
| Total Base Pair Counts |
|---|
| Total TP |
979 |
| Total TN |
1275527 |
| Total FP |
366 |
| Total FP CONTRA |
40 |
| Total FP INCONS |
235 |
| Total FP COMP |
91 |
| Total FN |
770 |
| Total Scores |
|---|
| MCC |
0.661 |
| Average MCC ± 95% Confidence Intervals |
0.650
±
0.070
|
| Sensitivity |
0.560 |
| Positive Predictive Value |
0.781 |
| Nr of predictions |
35 |
Performance of Carnac(seed)
- scored lower in this pairwise comparison
1. Total counts & total scores for Carnac(seed)
| Total Base Pair Counts |
|---|
| Total TP |
316 |
| Total TN |
1276431 |
| Total FP |
36 |
| Total FP CONTRA |
3 |
| Total FP INCONS |
31 |
| Total FP COMP |
2 |
| Total FN |
1433 |
| Total Scores |
|---|
| MCC |
0.404 |
| Average MCC ± 95% Confidence Intervals |
0.154
±
0.103
|
| Sensitivity |
0.181 |
| Positive Predictive Value |
0.903 |
| Nr of predictions |
35 |
Matthews Correlation Coeffient, Sensitivity and Positive Predictive Value have been calculated based
on the paper by Gardener & Giegerich, 2004.
| 