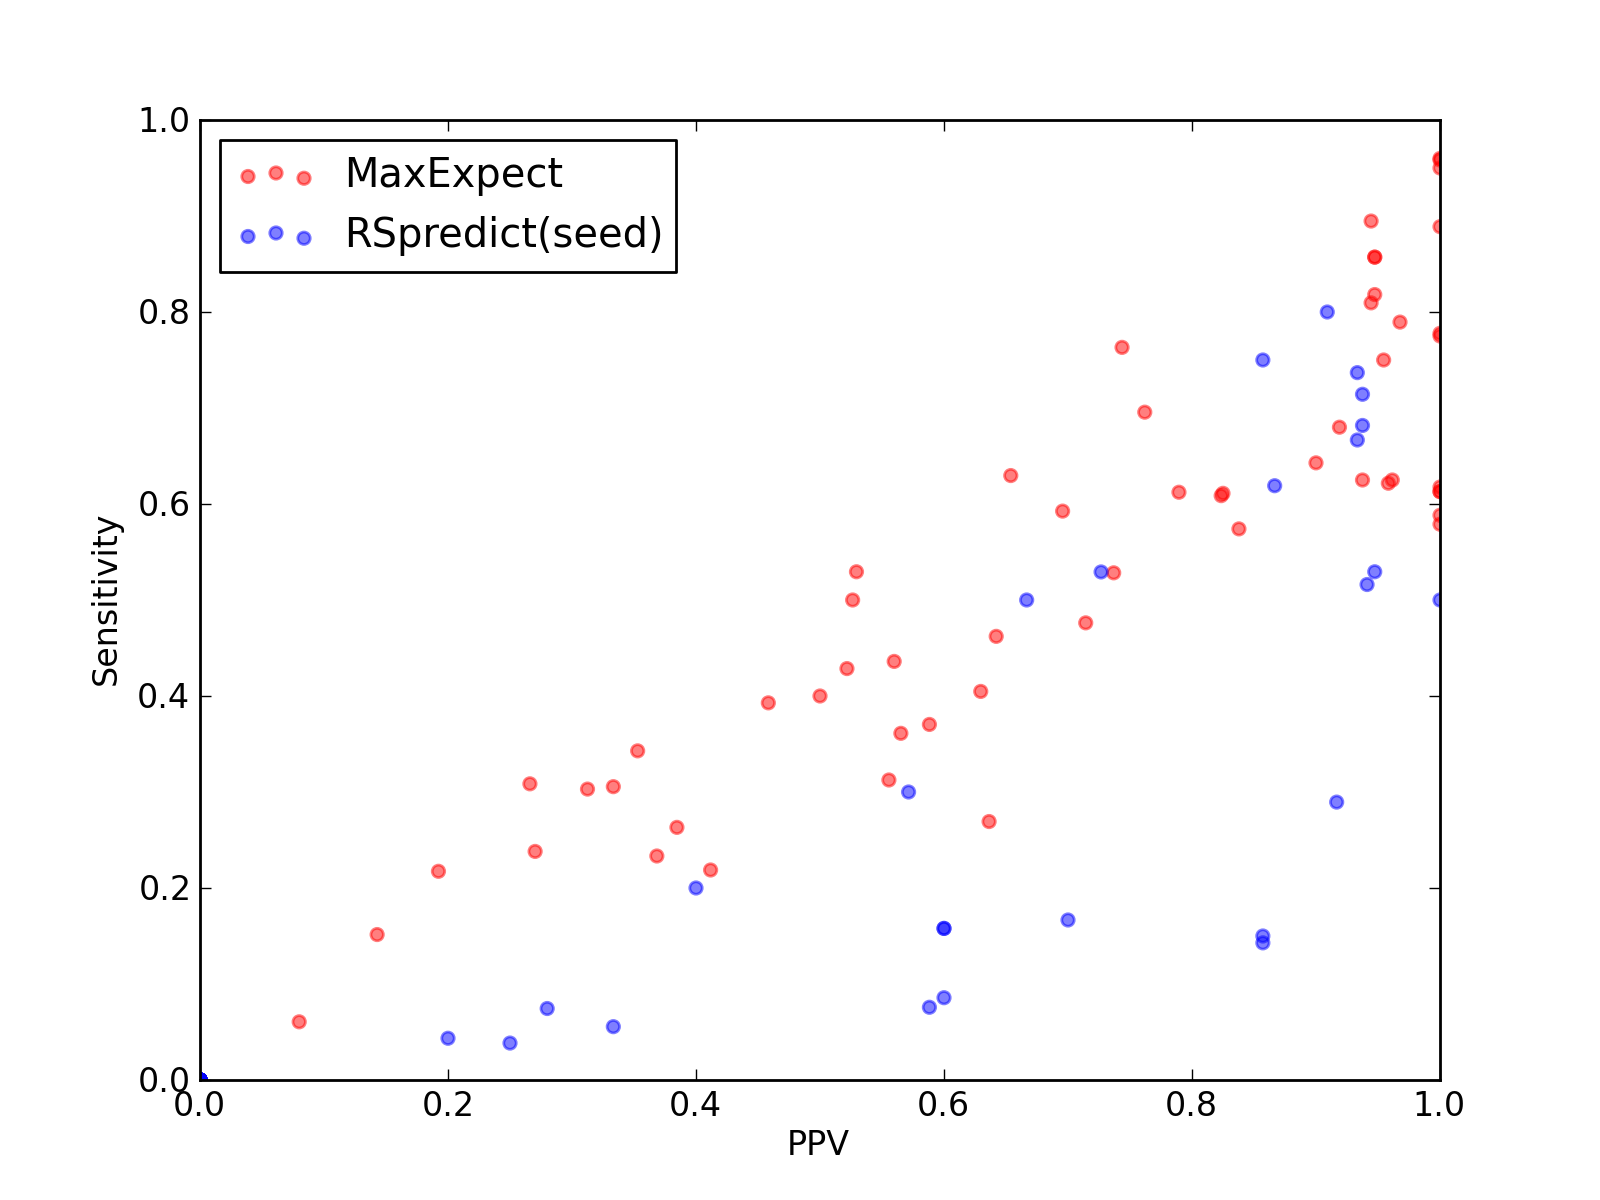
| 2KE6_A |
K10_TLS
links to Rfam database...
|
0.92 |
0.89 |
0.94 |
17 |
1110 |
2 |
0 |
1 |
1 |
2 |
| 2KUR_A |
K10_TLS
links to Rfam database...
|
0.90 |
0.86 |
0.95 |
18 |
1109 |
1 |
0 |
1 |
0 |
3 |
| 2KUU_A |
K10_TLS
links to Rfam database...
|
0.87 |
0.81 |
0.94 |
17 |
1110 |
2 |
0 |
1 |
1 |
4 |
| 2KUV_A |
K10_TLS
links to Rfam database...
|
0.88 |
0.82 |
0.95 |
18 |
1109 |
1 |
0 |
1 |
0 |
4 |
| 2KUW_A |
K10_TLS
links to Rfam database...
|
0.90 |
0.86 |
0.95 |
18 |
1109 |
1 |
0 |
1 |
0 |
3 |
| 2KX8_A |
7SK
links to Rfam database...
|
0.94 |
0.89 |
1.00 |
16 |
845 |
0 |
0 |
0 |
0 |
2 |
| 2L1F_A |
Gammaretro_CES
links to Rfam database...
|
0.98 |
0.96 |
1.00 |
23 |
2057 |
0 |
0 |
0 |
0 |
1 |
| 2L1F_B |
Gammaretro_CES
links to Rfam database...
|
0.98 |
0.96 |
1.00 |
24 |
2121 |
0 |
0 |
0 |
0 |
1 |
| 2L94_A |
HIV_FE
links to Rfam database...
|
0.97 |
0.95 |
1.00 |
19 |
971 |
0 |
0 |
0 |
0 |
1 |
| 2LC8_A |
GP_knot1
links to Rfam database...
|
-0.01 |
0.00 |
0.00 |
0 |
1525 |
15 |
2 |
13 |
0 |
20 |
| 2WRQ_Y |
tRNA
links to Rfam database...
|
0.53 |
0.53 |
0.53 |
9 |
2833 |
13 |
5 |
3 |
5 |
8 |
| 2WWQ_V |
tRNA
links to Rfam database...
|
0.76 |
0.64 |
0.90 |
18 |
2906 |
3 |
0 |
2 |
1 |
10 |
| 2XKV_B |
Bacteria_small_SRP
links to Rfam database...
|
0.51 |
0.50 |
0.53 |
10 |
4541 |
24 |
0 |
9 |
15 |
10 |
| 2XQD_Y |
tRNA
links to Rfam database...
|
0.88 |
0.78 |
1.00 |
21 |
2829 |
0 |
0 |
0 |
0 |
6 |
| 2XXA_G |
Bacteria_small_SRP
links to Rfam database...
|
0.25 |
0.24 |
0.27 |
10 |
5114 |
27 |
1 |
26 |
0 |
32 |
| 3A2K_C |
tRNA
links to Rfam database...
|
0.42 |
0.39 |
0.46 |
11 |
2902 |
13 |
2 |
11 |
0 |
17 |
| 3AKZ_H |
tRNA
links to Rfam database...
|
0.84 |
0.75 |
0.95 |
21 |
2679 |
1 |
1 |
0 |
0 |
7 |
| 3AMU_B |
tRNA
links to Rfam database...
|
0.64 |
0.59 |
0.70 |
16 |
2980 |
9 |
0 |
7 |
2 |
11 |
| 3GX2_A |
SAM
links to Rfam database...
|
0.77 |
0.63 |
0.96 |
25 |
4345 |
2 |
0 |
1 |
1 |
15 |
| 3IVN_B |
Purine
links to Rfam database...
|
0.78 |
0.61 |
1.00 |
19 |
2327 |
0 |
0 |
0 |
0 |
12 |
| 3IYQ_A |
tmRNA
links to Rfam database...
|
0.29 |
0.31 |
0.27 |
29 |
60617 |
84 |
19 |
61 |
4 |
65 |
| 3IZ4_A |
tmRNA
links to Rfam database...
|
0.54 |
0.46 |
0.64 |
61 |
70781 |
39 |
3 |
31 |
5 |
71 |
| 3IZF_C |
5S_rRNA
links to Rfam database...
|
0.71 |
0.61 |
0.83 |
33 |
6863 |
7 |
1 |
6 |
0 |
21 |
| 3J16_L |
tRNA
links to Rfam database...
|
0.29 |
0.23 |
0.37 |
7 |
2756 |
12 |
0 |
12 |
0 |
23 |
| 3J20_0 |
tRNA
links to Rfam database...
|
0.44 |
0.40 |
0.50 |
12 |
2826 |
13 |
0 |
12 |
1 |
18 |
| 3J20_2 |
SSU_rRNA_archaea
links to Rfam database...
|
0.49 |
0.44 |
0.56 |
276 |
1116272 |
221 |
10 |
207 |
4 |
357 |
| 3J20_1 |
tRNA
links to Rfam database...
|
0.73 |
0.70 |
0.76 |
16 |
2905 |
5 |
0 |
5 |
0 |
7 |
| 3J2L_3 |
5S_rRNA
links to Rfam database...
|
0.62 |
0.53 |
0.74 |
28 |
7837 |
12 |
0 |
10 |
2 |
25 |
| 3J3D_C |
tRNA
links to Rfam database...
|
0.47 |
0.43 |
0.52 |
12 |
2752 |
11 |
1 |
10 |
0 |
16 |
| 3J3E_8 |
5_8S_rRNA
links to Rfam database...
|
0.07 |
0.06 |
0.08 |
2 |
7478 |
32 |
2 |
21 |
9 |
31 |
| 3J3E_7 |
5S_rRNA
links to Rfam database...
|
0.46 |
0.37 |
0.59 |
20 |
7106 |
14 |
1 |
13 |
0 |
34 |
| 3J3F_8 |
5_8S_rRNA
links to Rfam database...
|
0.32 |
0.31 |
0.33 |
11 |
12213 |
36 |
3 |
19 |
14 |
25 |
| 3J3F_7 |
5S_rRNA
links to Rfam database...
|
0.79 |
0.68 |
0.92 |
34 |
7223 |
4 |
0 |
3 |
1 |
16 |
| 3JYV_7 |
tRNA
links to Rfam database...
|
0.41 |
0.31 |
0.56 |
10 |
2832 |
8 |
0 |
8 |
0 |
22 |
| 3JYX_3 |
5S_rRNA
links to Rfam database...
|
0.64 |
0.63 |
0.65 |
17 |
6302 |
19 |
1 |
8 |
10 |
10 |
| 3JYX_4 |
5_8S_rRNA
links to Rfam database...
|
0.31 |
0.30 |
0.31 |
10 |
12214 |
34 |
4 |
18 |
12 |
23 |
| 3LA5_A |
Purine
links to Rfam database...
|
0.78 |
0.62 |
1.00 |
21 |
2464 |
0 |
0 |
0 |
0 |
13 |
| 3NPB_A |
SAM
links to Rfam database...
|
0.71 |
0.61 |
0.82 |
28 |
6987 |
9 |
0 |
6 |
3 |
18 |
| 3O58_2 |
5S_rRNA
links to Rfam database...
|
0.75 |
0.76 |
0.74 |
29 |
7221 |
11 |
3 |
7 |
1 |
9 |
| 3O58_3 |
5_8S_rRNA
links to Rfam database...
|
0.35 |
0.34 |
0.35 |
12 |
12369 |
35 |
2 |
20 |
13 |
23 |
| 3PDR_A |
ykoK
links to Rfam database...
|
0.76 |
0.63 |
0.94 |
45 |
12832 |
5 |
0 |
3 |
2 |
27 |
| 3RKF_A |
Purine
links to Rfam database...
|
0.76 |
0.59 |
1.00 |
20 |
2191 |
0 |
0 |
0 |
0 |
14 |
| 3SD1_A |
THF
links to Rfam database...
|
0.58 |
0.48 |
0.71 |
20 |
3888 |
8 |
1 |
7 |
0 |
22 |
| 3UZL_B |
tRNA
links to Rfam database...
|
0.77 |
0.62 |
0.96 |
23 |
3546 |
1 |
0 |
1 |
0 |
14 |
| 3W1K_J |
tRNA-Sec
links to Rfam database...
|
0.87 |
0.79 |
0.97 |
30 |
4155 |
1 |
1 |
0 |
0 |
8 |
| 3W3S_B |
tRNA-Sec
links to Rfam database...
|
0.88 |
0.78 |
1.00 |
31 |
4722 |
1 |
0 |
0 |
1 |
9 |
| 3ZEX_C |
5_8S_rRNA
links to Rfam database...
|
0.41 |
0.27 |
0.64 |
14 |
14174 |
16 |
2 |
6 |
8 |
38 |
| 3ZEX_D |
5S_rRNA
links to Rfam database...
|
0.69 |
0.61 |
0.79 |
30 |
6983 |
8 |
1 |
7 |
0 |
19 |
| 3ZND_W |
tRNA
links to Rfam database...
|
0.20 |
0.22 |
0.19 |
5 |
2977 |
23 |
1 |
20 |
2 |
18 |
| 4A1C_2 |
5_8S_rRNA
links to Rfam database...
|
0.14 |
0.15 |
0.14 |
5 |
11746 |
41 |
4 |
26 |
11 |
28 |
| 4A1C_3 |
5S_rRNA
links to Rfam database...
|
0.69 |
0.57 |
0.84 |
31 |
7103 |
6 |
0 |
6 |
0 |
23 |
| 4AOB_A |
SAM
links to Rfam database...
|
0.50 |
0.40 |
0.63 |
17 |
4344 |
11 |
2 |
8 |
1 |
25 |
| 4ENB_A |
crcB
links to Rfam database...
|
0.76 |
0.58 |
1.00 |
11 |
1264 |
0 |
0 |
0 |
0 |
8 |
| 4ENC_A |
crcB
links to Rfam database...
|
0.31 |
0.26 |
0.38 |
5 |
1313 |
8 |
1 |
7 |
0 |
14 |
| 4FRG_B |
AdoCbl-variant
links to Rfam database...
|
0.30 |
0.22 |
0.41 |
7 |
3469 |
10 |
1 |
9 |
0 |
25 |
| 4FRN_A |
AdoCbl-variant
links to Rfam database...
|
0.45 |
0.36 |
0.57 |
13 |
5128 |
10 |
2 |
8 |
0 |
23 |
| 4JF2_A |
preQ1-II
links to Rfam database...
|
0.78 |
0.61 |
1.00 |
19 |
2831 |
0 |
0 |
0 |
0 |
12 |