Table of contents:
- Overview
- Performance Plots
- Performance of PETfold_pre2.0(seed)
- scored higher in this pairwise comparison
- Performance of CentroidHomfold‑LAST
- scored lower in this pairwise comparison
- Compile and download dataset for PETfold_pre2.0(seed) & CentroidHomfold‑LAST [.zip] - may take several seconds...
Overview
| Metric |
PETfold_pre2.0(seed) |
|
CentroidHomfold‑LAST |
|---|
| MCC |
0.729 |
>
|
0.574 |
| Average MCC ± 95% Confidence Intervals |
0.702
±
0.065
|
>
|
0.567
±
0.112
|
| Sensitivity |
0.606 |
>
|
0.489 |
| Positive Predictive Value |
0.882 |
>
|
0.680 |
| Total TP |
502 |
>
|
405 |
| Total TN |
117069 |
>
|
117042 |
| Total FP |
93 |
<
|
218 |
| Total FP CONTRA |
6 |
<
|
21 |
| Total FP INCONS |
61 |
<
|
170 |
| Total FP COMP |
26 |
<
|
27 |
| Total FN |
327 |
<
|
424 |
| P-value |
5.23657817852e-08 |
Performance plots
-
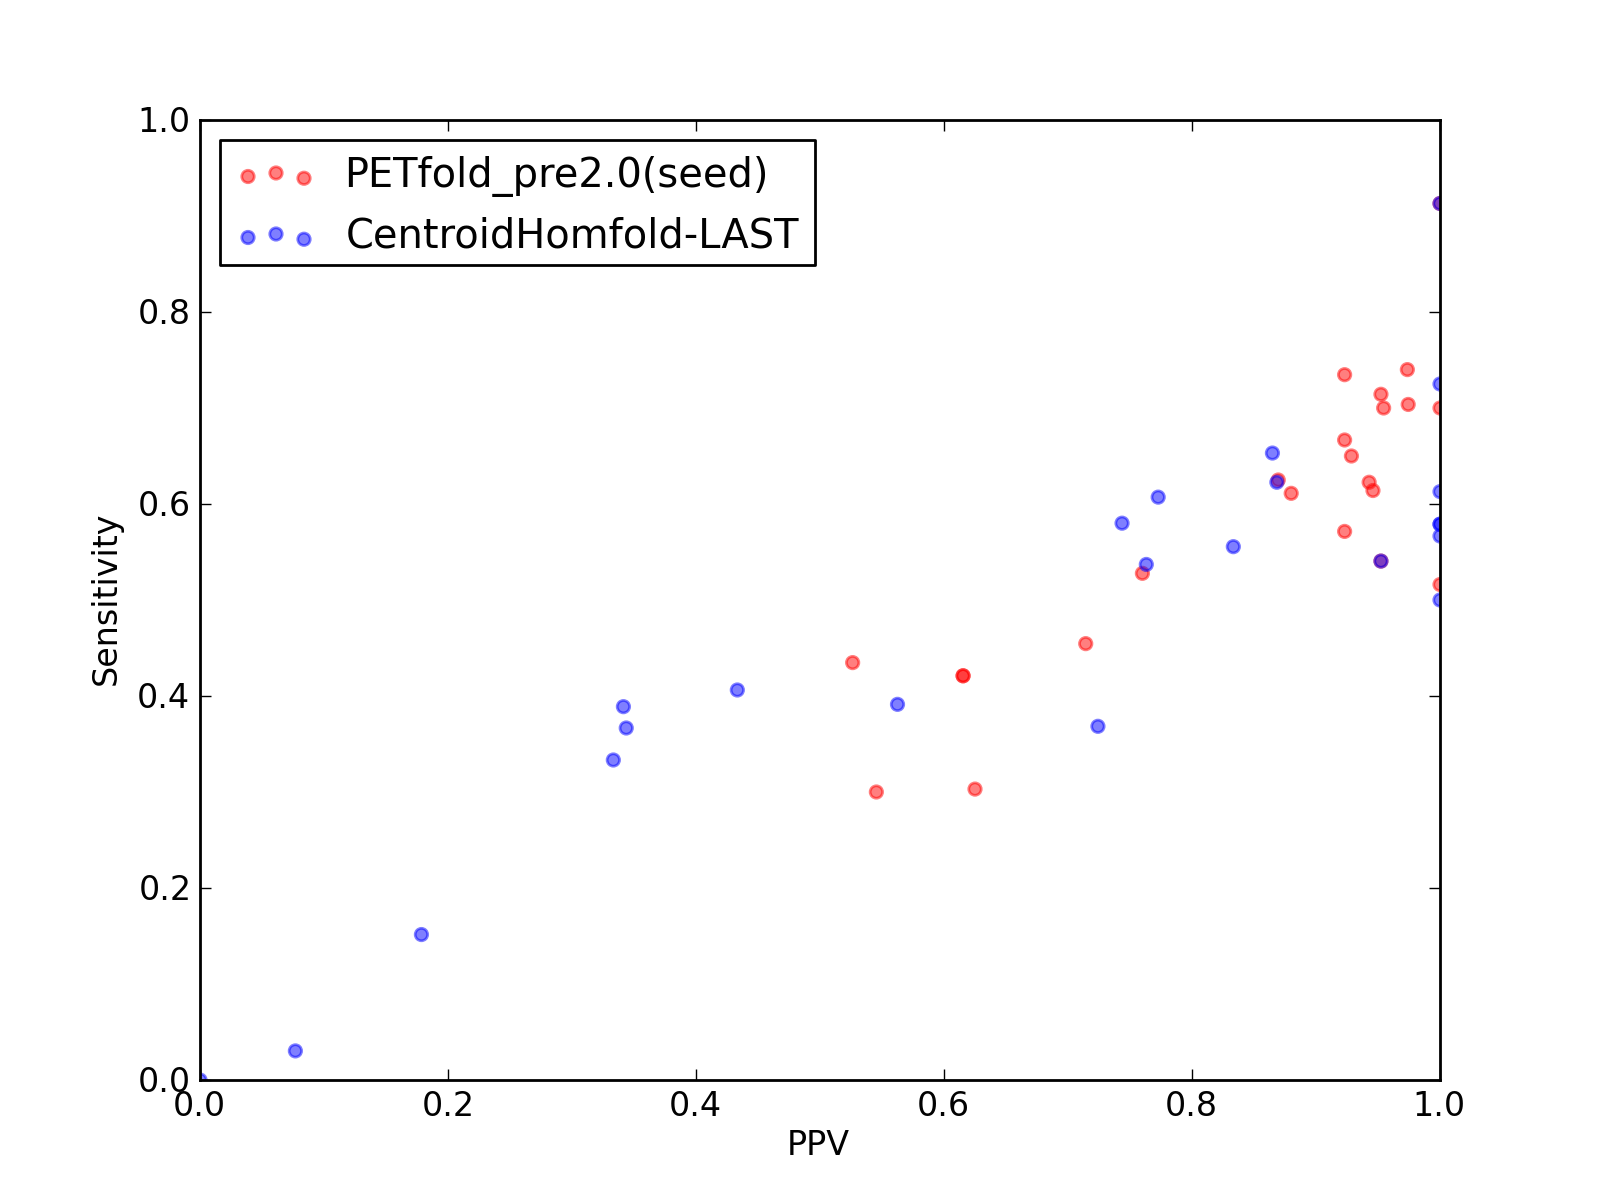
Comparison of performance of PETfold_pre2.0(seed) and CentroidHomfold-LAST. Positive Predictive Value (PPV) is plotted against sensitivity. Each dot represents a single test of each method. See tables below for raw data
(individual counts for PETfold_pre2.0(seed)
and CentroidHomfold‑LAST).
-
Comparison of performance of PETfold_pre2.0(seed) and CentroidHomfold-LAST. Positive Predictive Value (PPV) is plotted against sensitivity. Each dot represents a single test of each method. See tables below for raw data
(individual counts for PETfold_pre2.0(seed)
and CentroidHomfold‑LAST).

-
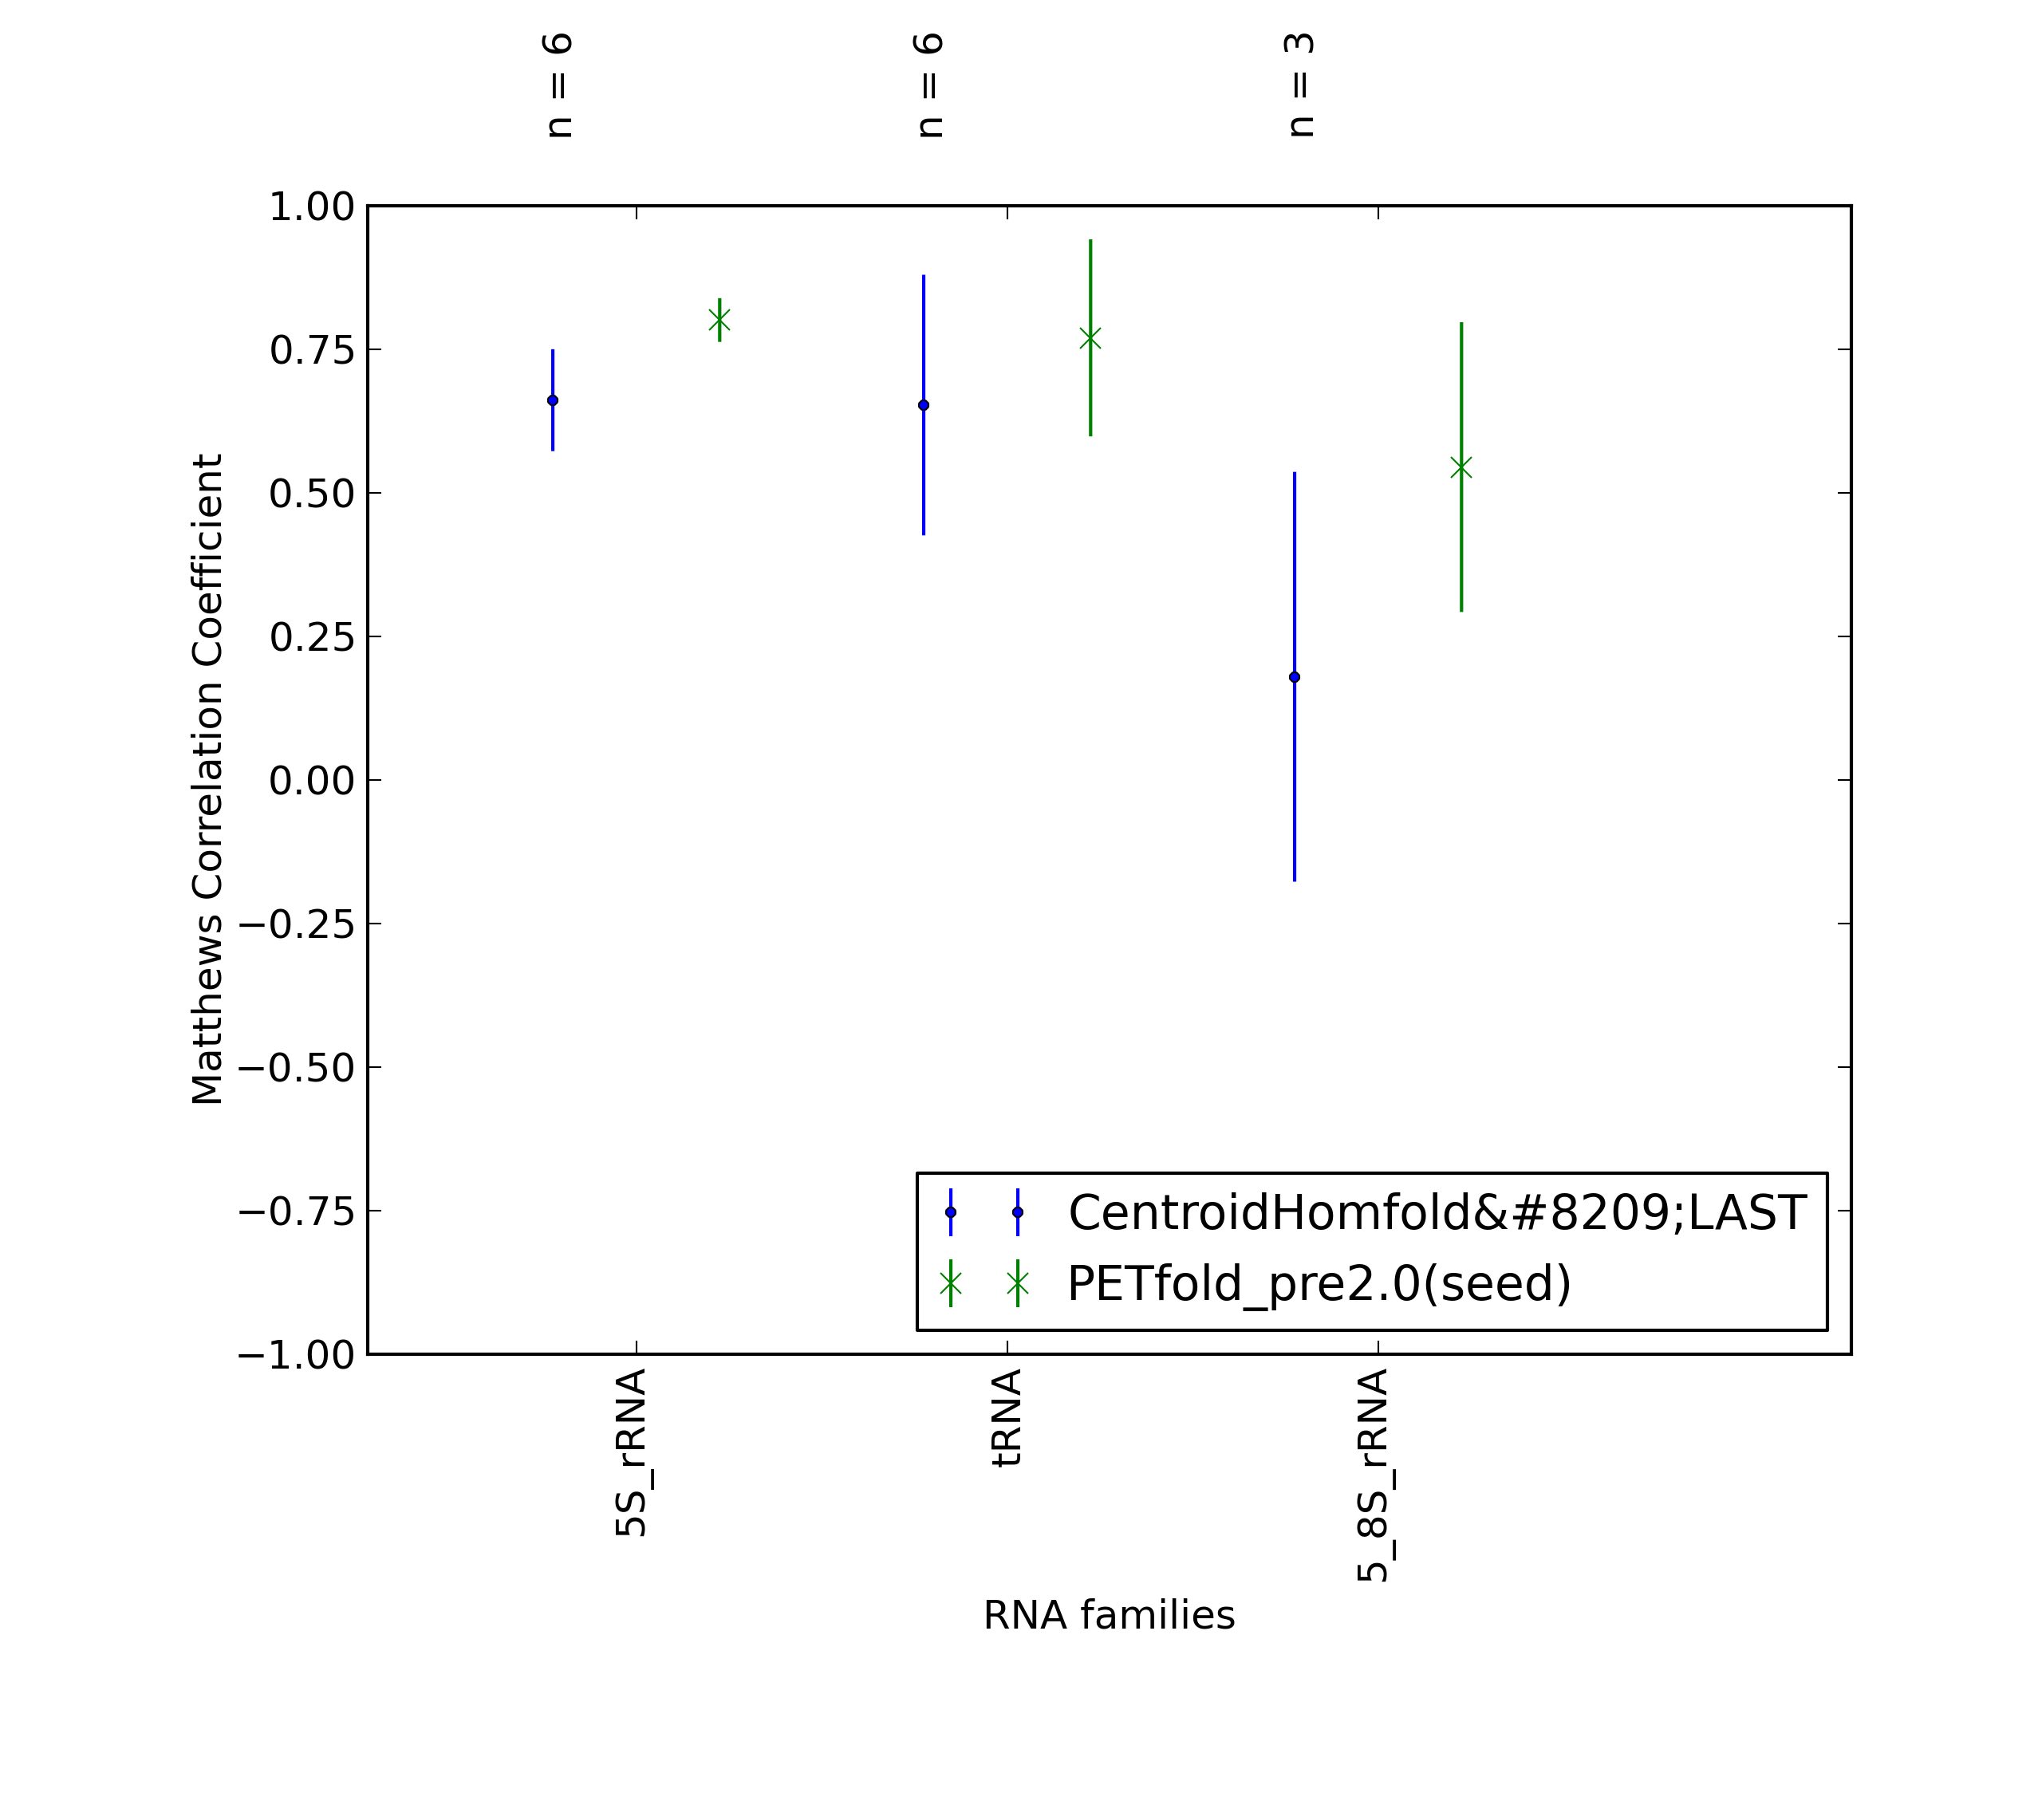
Average Matthews Correlation Coefficients (MCC) with 95% confidence intervals (CIs) were plotted for different RNA families, for which at least 3 members were present in the benchmarking dataset. 'n' denotes the number of MCCs used to calculate the average and CI. See tables below for raw data
(individual counts for PETfold_pre2.0(seed)
and CentroidHomfold‑LAST).
-
Average Matthews Correlation Coefficients (MCC) with 95% confidence intervals (CIs) were plotted for different RNA families, for which at least 3 members were present in the benchmarking dataset. 'n' denotes the number of MCCs used to calculate the average and CI. See tables below for raw data
(individual counts for PETfold_pre2.0(seed)
and CentroidHomfold‑LAST).

-
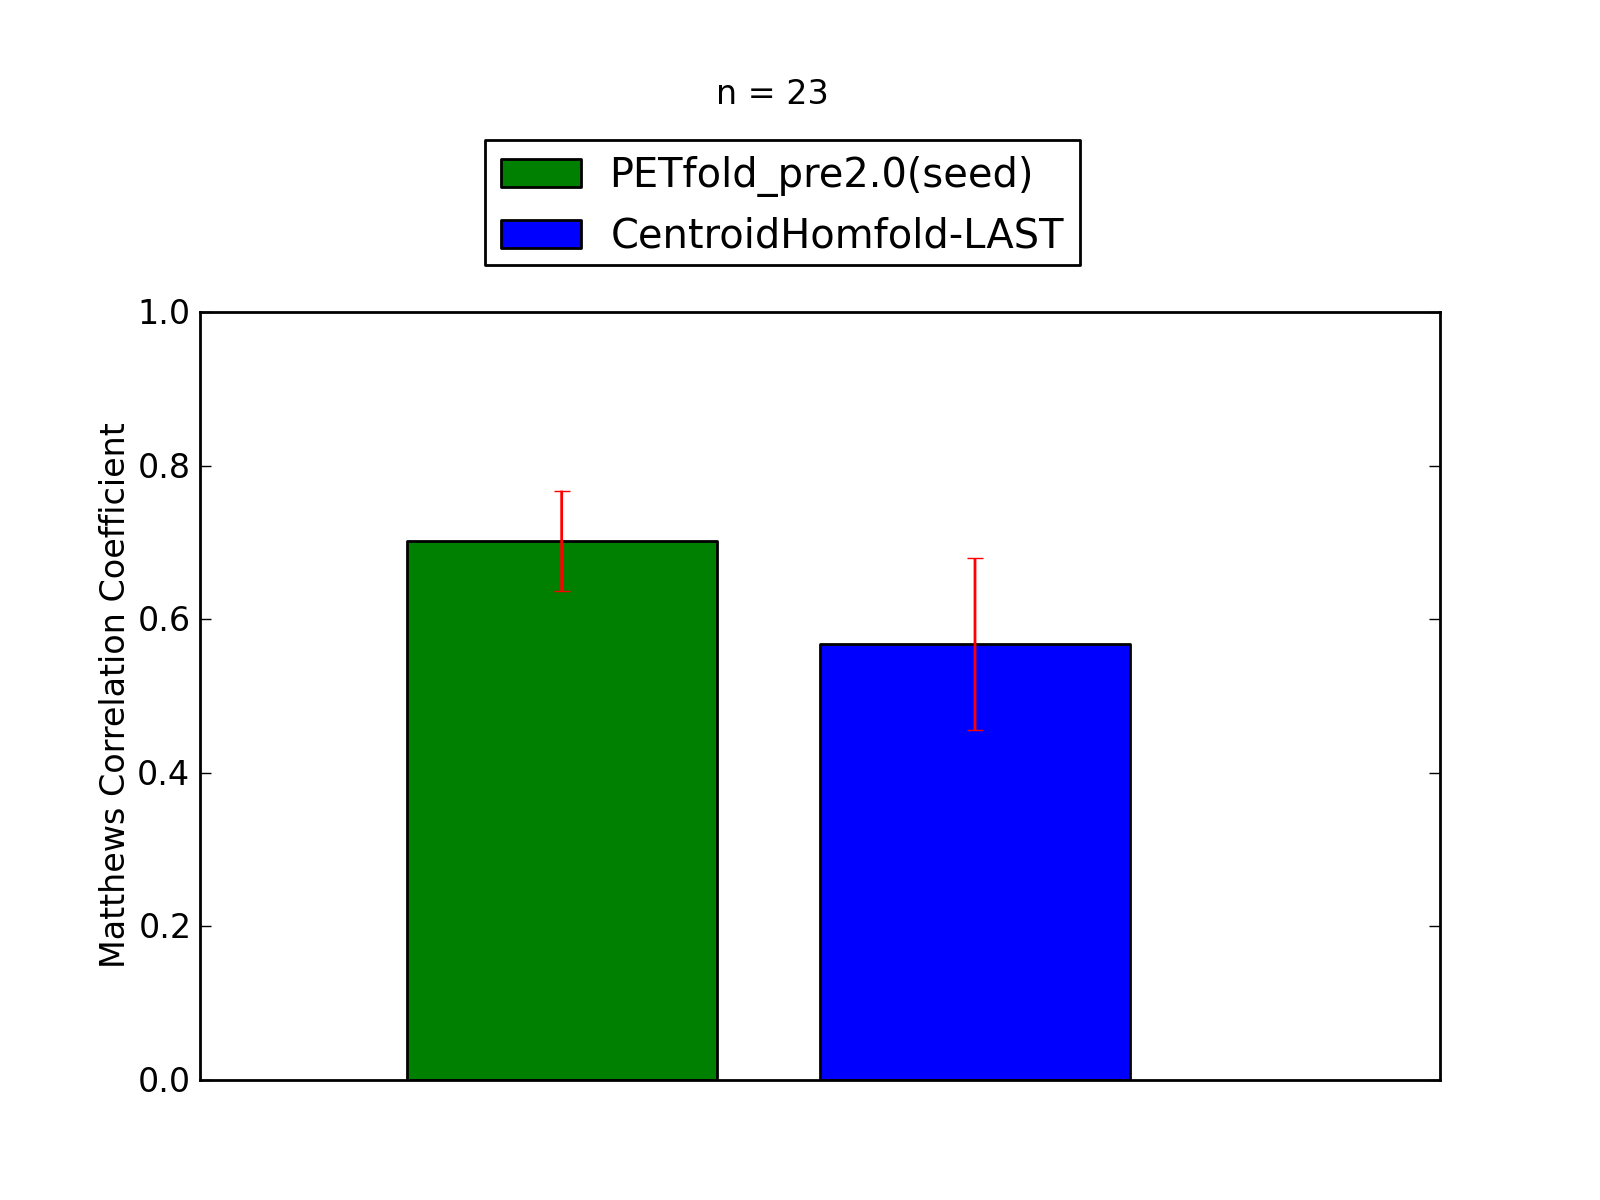
Comparison of average Matthews Correlation Coefficients (MCCs) for PETfold_pre2.0(seed) and CentroidHomfold-LAST. The whiskers correspond to 95% confidence intervals (CIs). 'n' denotes the number of MCCs used to calculate average MCCs and CIs. See tables below for raw data
(individual counts for PETfold_pre2.0(seed)
and CentroidHomfold‑LAST).

-
Comparison of average Matthews Correlation Coefficients (MCCs) for PETfold_pre2.0(seed) and CentroidHomfold-LAST. The whiskers correspond to 95% confidence intervals (CIs). 'n' denotes the number of MCCs used to calculate average MCCs and CIs. See tables below for raw data
(individual counts for PETfold_pre2.0(seed)
and CentroidHomfold‑LAST).
Performance of PETfold_pre2.0(seed)
- scored higher in this pairwise comparison
1. Total counts & total scores for PETfold_pre2.0(seed)
| Total Base Pair Counts |
|---|
| Total TP |
502 |
| Total TN |
117069 |
| Total FP |
93 |
| Total FP CONTRA |
6 |
| Total FP INCONS |
61 |
| Total FP COMP |
26 |
| Total FN |
327 |
| Total Scores |
|---|
| MCC |
0.729 |
| Average MCC ± 95% Confidence Intervals |
0.702
±
0.065
|
| Sensitivity |
0.606 |
| Positive Predictive Value |
0.882 |
| Nr of predictions |
23 |
Performance of CentroidHomfold‑LAST
- scored lower in this pairwise comparison
1. Total counts & total scores for CentroidHomfold‑LAST
| Total Base Pair Counts |
|---|
| Total TP |
405 |
| Total TN |
117042 |
| Total FP |
218 |
| Total FP CONTRA |
21 |
| Total FP INCONS |
170 |
| Total FP COMP |
27 |
| Total FN |
424 |
| Total Scores |
|---|
| MCC |
0.574 |
| Average MCC ± 95% Confidence Intervals |
0.567
±
0.112
|
| Sensitivity |
0.489 |
| Positive Predictive Value |
0.680 |
| Nr of predictions |
23 |
Matthews Correlation Coeffient, Sensitivity and Positive Predictive Value have been calculated based
on the paper by Gardener & Giegerich, 2004.
| 