Table of contents:
- Overview
- Performance Plots
- Performance of PETfold_pre2.0(seed)
- scored higher in this pairwise comparison
- Performance of RNAsubopt
- scored lower in this pairwise comparison
- Compile and download dataset for PETfold_pre2.0(seed) & RNAsubopt [.zip] - may take several seconds...
Overview
| Metric |
PETfold_pre2.0(seed) |
|
RNAsubopt |
|---|
| MCC |
0.789 |
>
|
0.523 |
| Average MCC ± 95% Confidence Intervals |
0.768
±
0.077
|
>
|
0.506
±
0.160
|
| Sensitivity |
0.726 |
>
|
0.562 |
| Positive Predictive Value |
0.861 |
>
|
0.497 |
| Total TP |
247 |
>
|
191 |
| Total TN |
30025 |
>
|
29928 |
| Total FP |
87 |
<
|
254 |
| Total FP CONTRA |
17 |
<
|
62 |
| Total FP INCONS |
23 |
<
|
131 |
| Total FP COMP |
47 |
<
|
61 |
| Total FN |
93 |
<
|
149 |
| P-value |
2.9966815982e-08 |
Performance plots
-
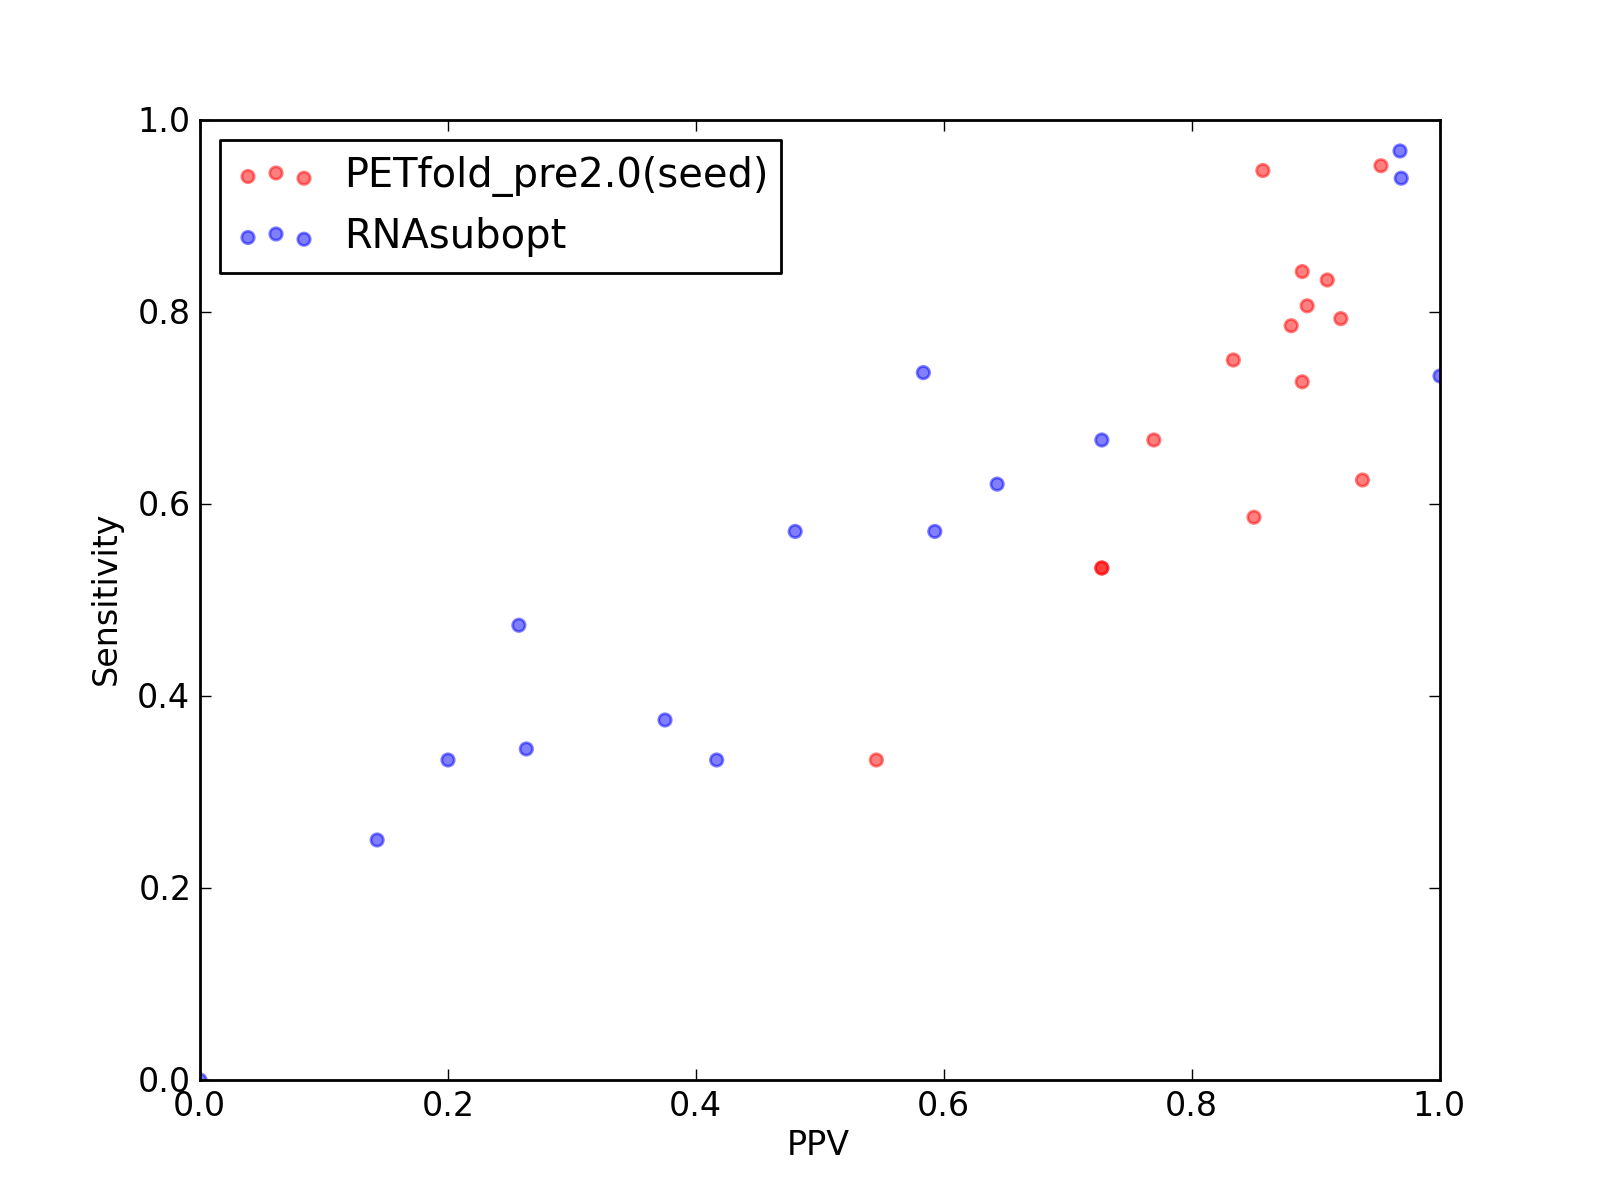
Comparison of performance of PETfold_pre2.0(seed) and RNAsubopt. Positive Predictive Value (PPV) is plotted against sensitivity. Each dot represents a single test of each method. See tables below for raw data
(individual counts for PETfold_pre2.0(seed)
and RNAsubopt).
-
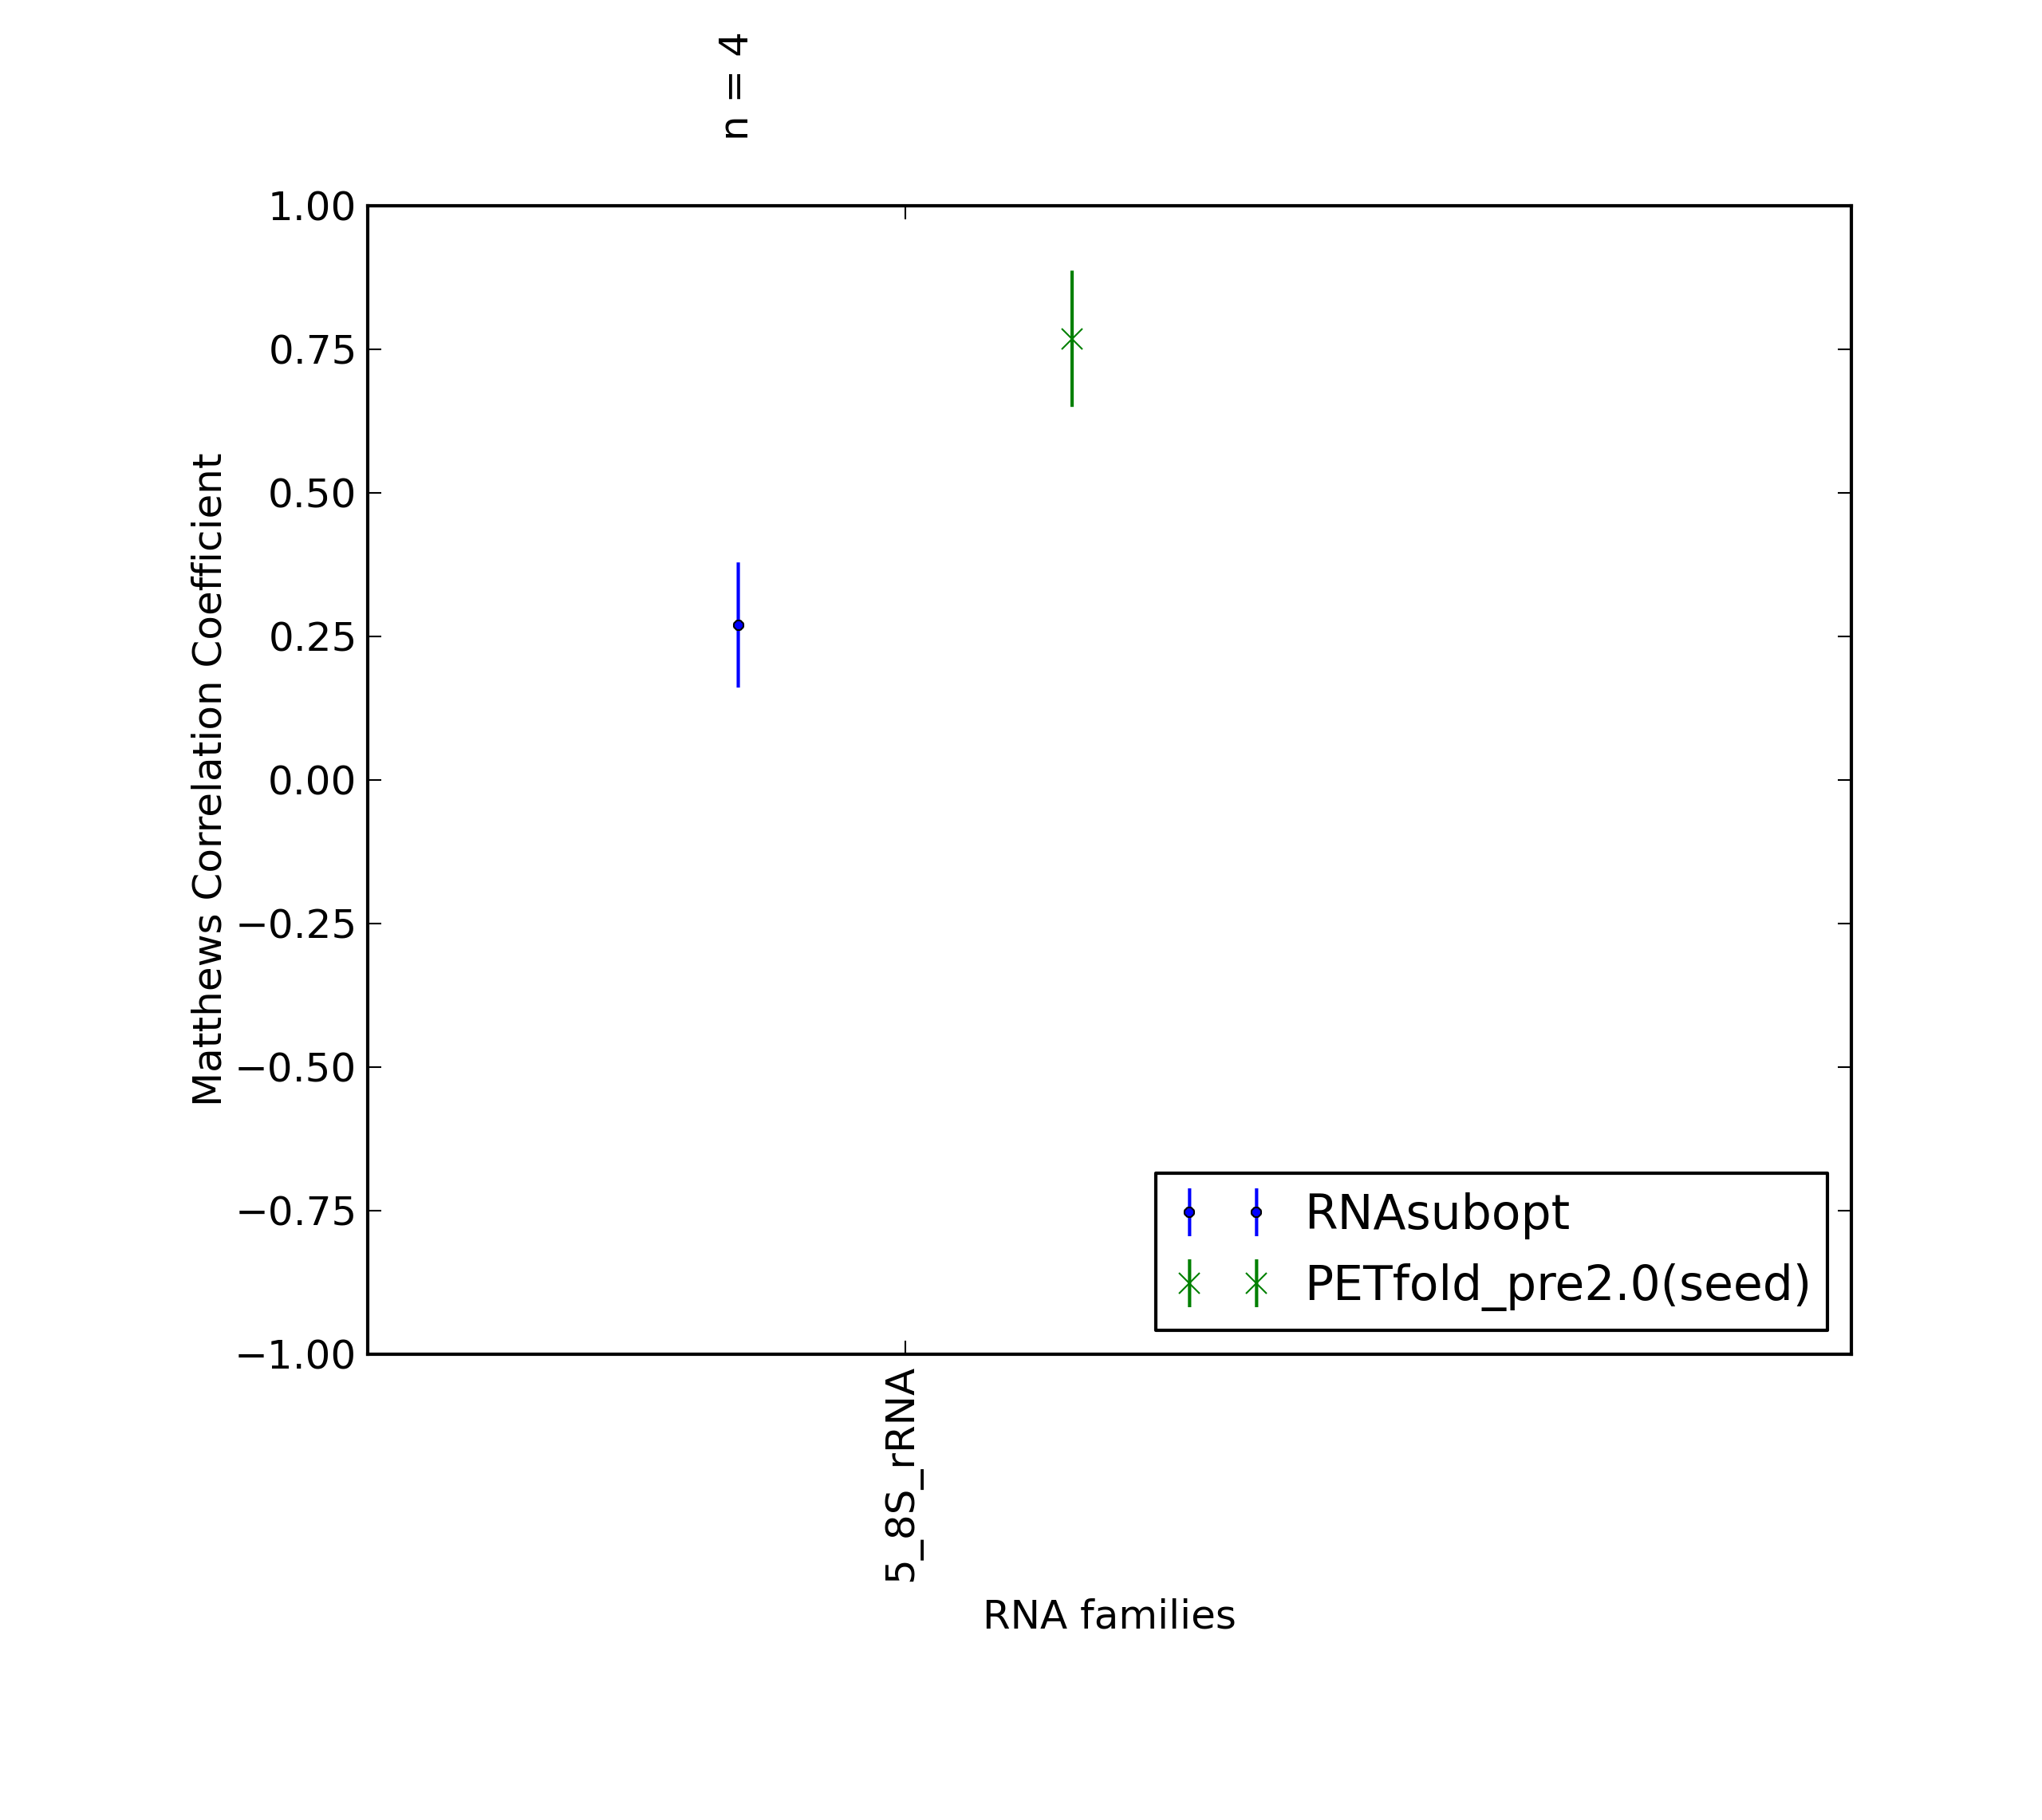
Average Matthews Correlation Coefficients (MCC) with 95% confidence intervals (CIs) were plotted for different RNA families, for which at least 3 members were present in the benchmarking dataset. 'n' denotes the number of MCCs used to calculate the average and CI. See tables below for raw data
(individual counts for PETfold_pre2.0(seed)
and RNAsubopt).
-
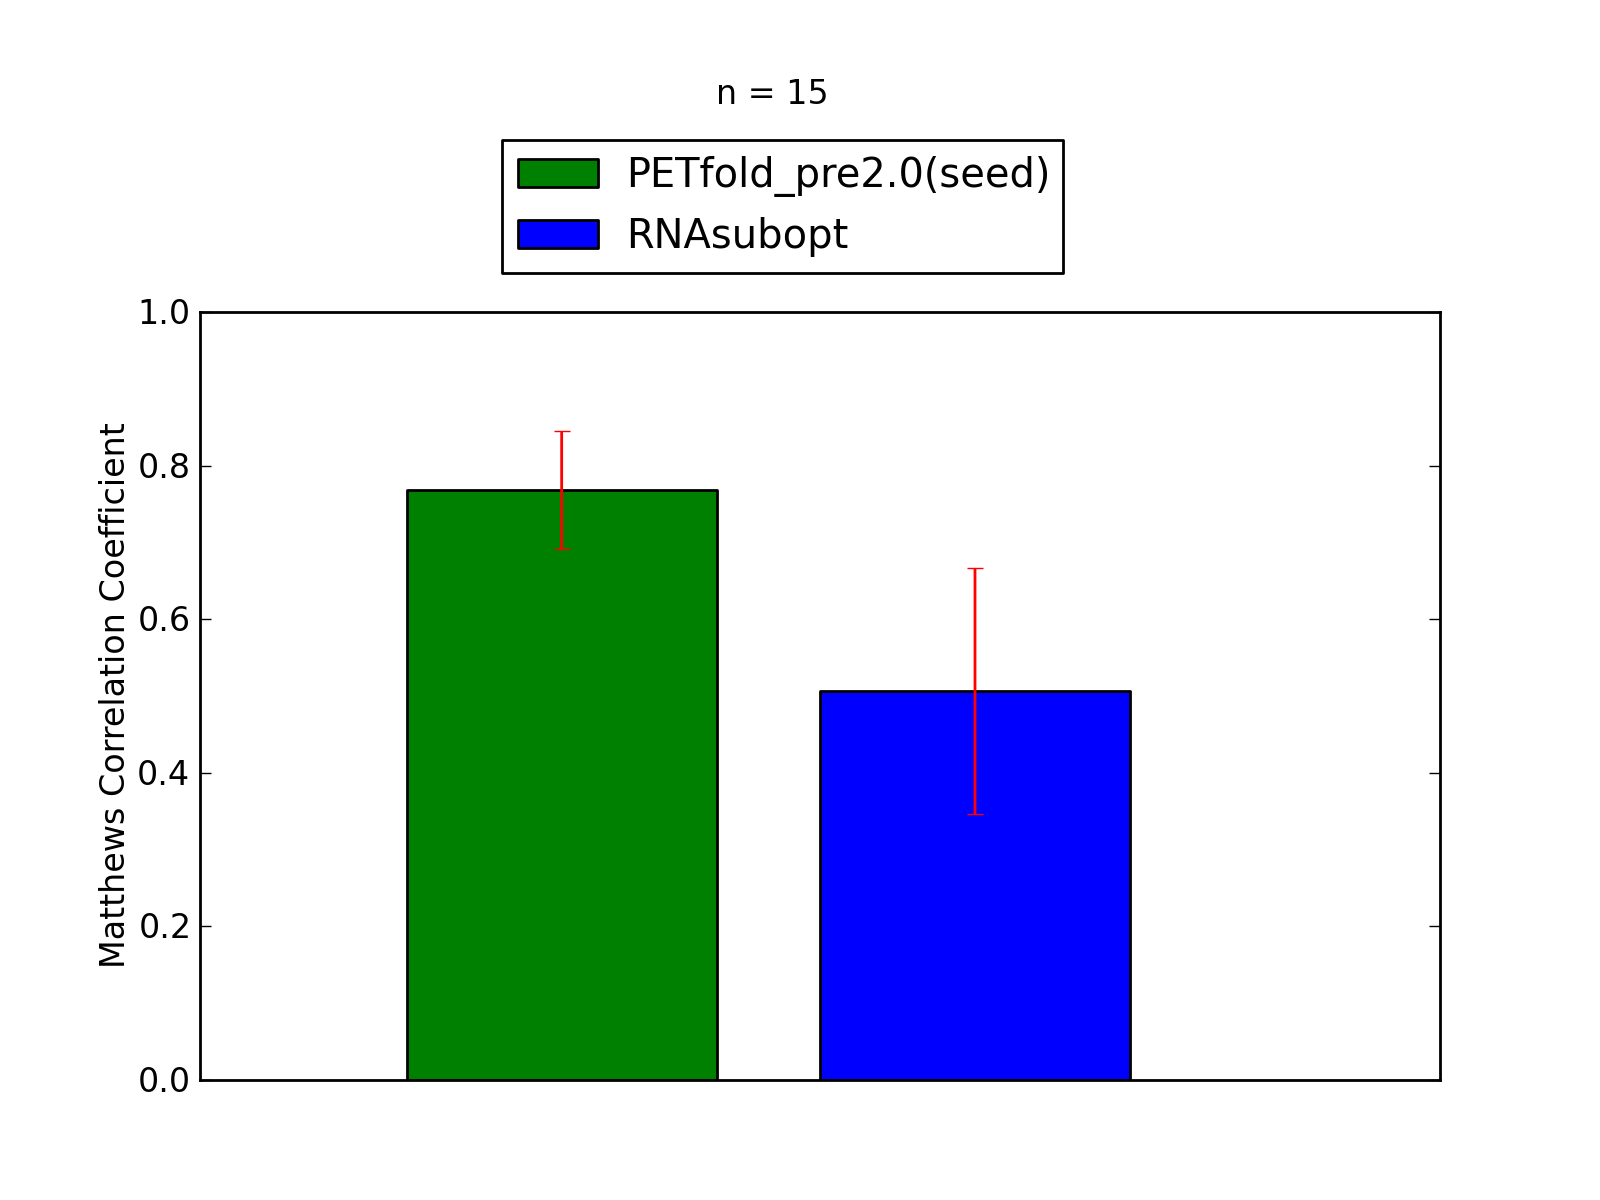
Comparison of average Matthews Correlation Coefficients (MCCs) for PETfold_pre2.0(seed) and RNAsubopt. The whiskers correspond to 95% confidence intervals (CIs). 'n' denotes the number of MCCs used to calculate average MCCs and CIs. See tables below for raw data
(individual counts for PETfold_pre2.0(seed)
and RNAsubopt).
Performance of PETfold_pre2.0(seed)
- scored higher in this pairwise comparison
1. Total counts & total scores for PETfold_pre2.0(seed)
| Total Base Pair Counts |
|---|
| Total TP |
247 |
| Total TN |
30025 |
| Total FP |
87 |
| Total FP CONTRA |
17 |
| Total FP INCONS |
23 |
| Total FP COMP |
47 |
| Total FN |
93 |
| Total Scores |
|---|
| MCC |
0.789 |
| Average MCC ± 95% Confidence Intervals |
0.768
±
0.077
|
| Sensitivity |
0.726 |
| Positive Predictive Value |
0.861 |
| Nr of predictions |
15 |
Performance of RNAsubopt
- scored lower in this pairwise comparison
1. Total counts & total scores for RNAsubopt
| Total Base Pair Counts |
|---|
| Total TP |
191 |
| Total TN |
29928 |
| Total FP |
254 |
| Total FP CONTRA |
62 |
| Total FP INCONS |
131 |
| Total FP COMP |
61 |
| Total FN |
149 |
| Total Scores |
|---|
| MCC |
0.523 |
| Average MCC ± 95% Confidence Intervals |
0.506
±
0.160
|
| Sensitivity |
0.562 |
| Positive Predictive Value |
0.497 |
| Nr of predictions |
15 |
Matthews Correlation Coeffient, Sensitivity and Positive Predictive Value have been calculated based
on the paper by Gardener & Giegerich, 2004.
| 